

Note
Go to the end to download the full example code.
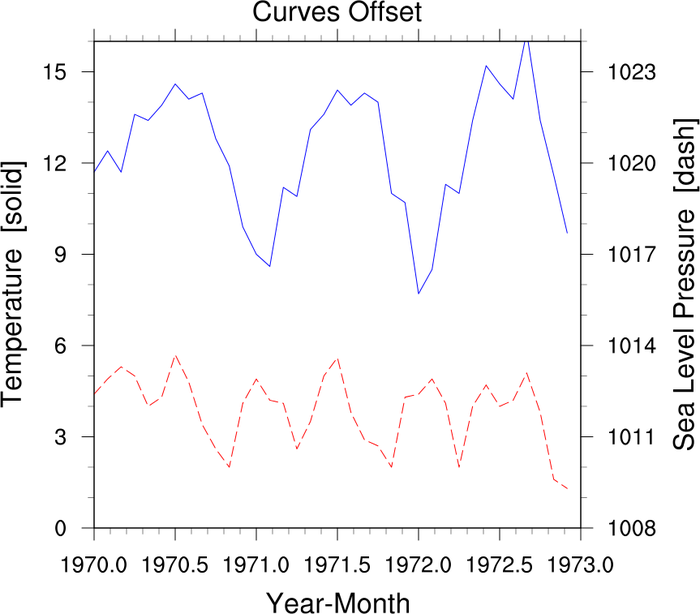
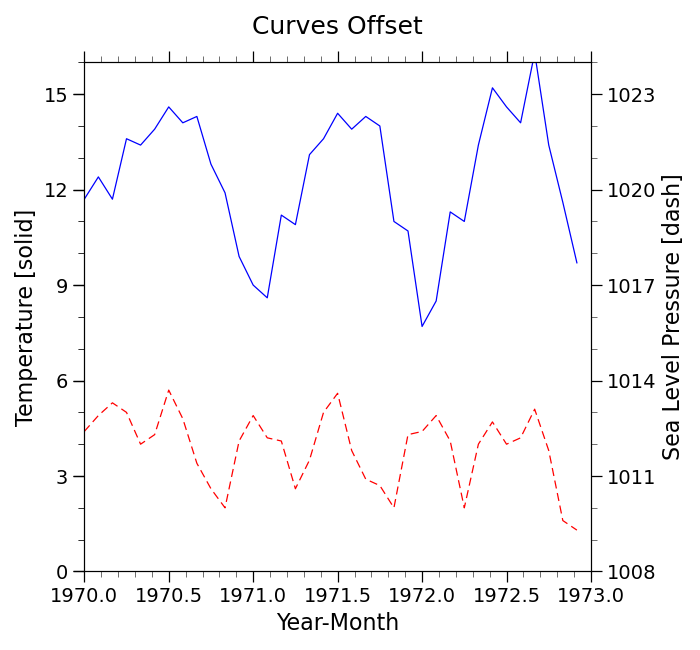
NCL_xy_7_2.py#
An example of a double y plot: two separate line with their own unique axis.
- This script illustrates the following concepts:
Drawing an XY plot with two different Y axes
Changing the title on the Y axis
Changing the line dash pattern in an XY plot
Changing the line color for multiple curves in an XY plot
Setting the minimum/maximum value of the Y axis in an XY plot
- See following URLs to see the reproduced NCL plot & script:
Original NCL script: https://www.ncl.ucar.edu/Applications/Scripts/xy_7.ncl
Original NCL plot: https://www.ncl.ucar.edu/Applications/Images/xy_7_2_lg.png
Import packages:
import matplotlib.pyplot as plt
import numpy as np
import xarray as xr

import geocat.datafiles as gdf
import geocat.viz as gv
Read in data:
# Open a netCDF data file using xarray default engine and load the data into xarrays
ds = xr.open_dataset(gdf.get("netcdf_files/TestData.xy3.nc"))
# Extract a slice of the data
ds = ds.isel(case=0, time=slice(0, 36))
Plot:
# Generate figure (set its size (width, height) in inches) and axes (with two different y-axes)
fig, ax1 = plt.subplots(figsize=(7, 6.5))

# Plot data
ax1.plot(ds.time, ds.T, color="blue", linestyle="-", linewidth=0.9)

# Usa geocat.viz.util convenience function to add minor and major tick lines
gv.add_major_minor_ticks(ax1, x_minor_per_major=5, labelsize=14)

# Usa geocat.viz.util convenience function to set axes parameters without calling several matplotlib functions
# Set axes limits, and tick values
gv.set_axes_limits_and_ticks(
    ax1, xlim=(1970, 1973), ylim=(0.0, 16.0), yticks=np.arange(0, 17, 3)
)

# Usa geocat.viz.util convenience function to set titles and labels without calling several matplotlib functions
gv.set_titles_and_labels(
    ax1,
    maintitle="Curves Offset",
    xlabel=ds.time.long_name,
    ylabel=f"{ds.T.long_name} [solid]",
)

# Create second y-axis
ax2 = ax1.twinx()

# Use geocat.viz.util convenience function to add minor and major tick lines
gv.add_major_minor_ticks(ax2, x_minor_per_major=5, labelsize=14)

# Line-plot data
ax2.plot(ds.time, ds.P, color="red", linestyle="--", dashes=[6.5, 3.7], linewidth=0.9)

# Use geocat.viz.util convenience function to set axes parameters without calling several matplotlib functions
# Set axes limits, and tick values
gv.set_axes_limits_and_ticks(
    ax2, ylim=(1008.0, 1024.0), yticks=np.arange(1008, 1025, 3)
)

# Set second y-axis label
ax2.set_ylabel(f"{ds.P.long_name} [dash]", fontsize=16)

# Show the plot
plt.tight_layout()
plt.show()
Total running time of the script: (0 minutes 0.395 seconds)