

Note
Go to the end to download the full example code.
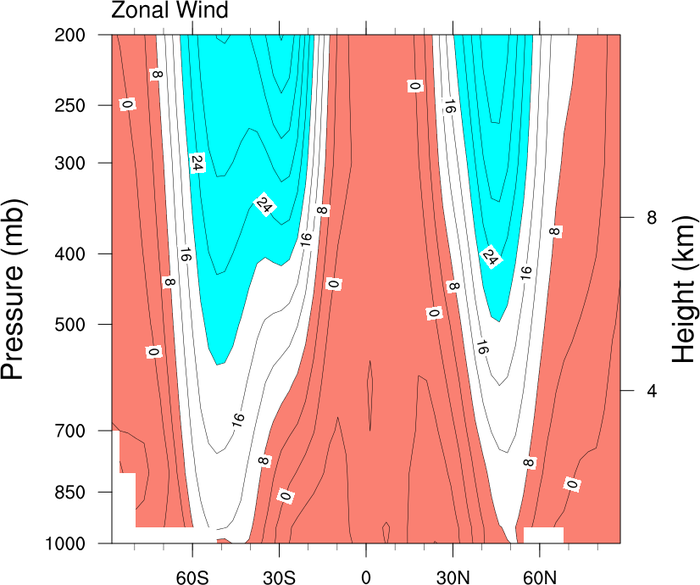
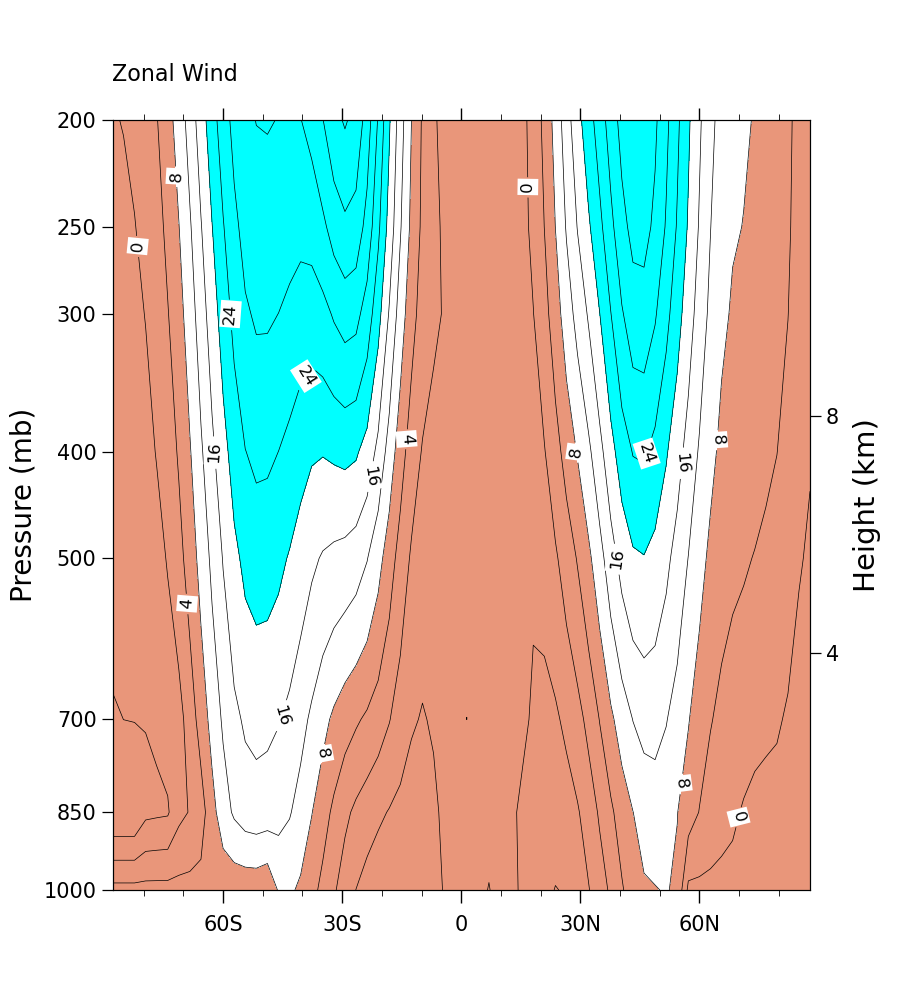
NCL_coneff_8.py#
- This script illustrates the following concepts:
Drawing pressure/height contours
Selectively coloring between contour levels
- See following URLs to see the reproduced NCL plot & script:
Original NCL script: https://www.ncl.ucar.edu/Applications/Scripts/coneff_8.ncl
Original NCL plot: https://www.ncl.ucar.edu/Applications/Images/coneff_8_lg.png
Import Packages:
import numpy as np
import xarray as xr
import matplotlib as mpl
import matplotlib.pyplot as plt
from cartopy.mpl.ticker import LatitudeFormatter

import geocat.datafiles as gdf
import geocat.viz as gv
from geocat.comp import interp_hybrid_to_pressure
Read in Data
# Open a netCDF data file using xarray default engine and load the data into an xarray
ds = xr.open_dataset(gdf.get('netcdf_files/atmos.nc'), decode_times=False)

# Select zonal wind
u = ds.U.isel(time=0)

# Define inputs for geocat-comp interpolation function
hyam = ds.hyam  # hybrid A coefficient
hybm = ds.hybm  # hybrid B coefficient
ps = ds.PS.isel(time=0)  # surface pressures in Pascals
p0 = 100000  # surface reference pressure in Pascals

# Specify output pressure levels in millibars
new_levels = np.array([1000, 850, 700, 500, 400, 300, 250, 200])
new_levels = new_levels * 100  # convert to Pascals

# Interpolate pressure coordinates from hybrid sigma coord
u_int = interp_hybrid_to_pressure(
    u, ps, hyam, hybm, p0=p0, new_levels=new_levels, method='log'
)
# Calculate zonal mean
uzon = u_int.mean(dim='lon')

# interpolate nan values
uzon = uzon.interpolate_na(dim='lat', method='nearest', fill_value='extrapolate')
Plot:
# Generate figure (set its size (width, height) in inches)
plt.figure(figsize=(9, 10))
ax1 = plt.gca()

# Format log axis
plt.yscale('log')

# Create custom colormap
colors = ["darksalmon", "white", "cyan"]
newcmp = mpl.colors.ListedColormap(colors)

# Plot filled contours
levels = np.arange(0, 36, 4)
p = uzon.plot.contourf(
    ax=ax1,
    levels=levels,
    vmin=-8,
    vmax=40,
    cmap=newcmp,
    add_colorbar=False,
    add_labels=False,
)

# Plot contour lines
contours = uzon.plot.contour(
    ax=ax1,
    levels=13,
    vmin=-8,
    vmax=40,
    colors='black',
    linewidths=0.5,
    linestyles='solid',
    add_labels=False,
)

# Label the contours
manual = [
    (-70, 55000),
    (-80, 26000),
    (-72, 22500),
    (-62, 40000),
    (-58, 30000),
    (-45, 69500),
    (-40, 34000),
    (-12, 39000),
    (-37, 75000),
    (40, 50000),
    (-25, 42000),
    (18, 23000),
    (30, 40000),
    (45, 40000),
    (57, 41000),
    (63, 39000),
    (55, 80000),
    (65, 85000),
]
clabels = ax1.clabel(contours, fontsize=12, colors="black", fmt="%.0f", manual=manual)
# Set background color to white for contour labels
[txt.set_bbox(dict(facecolor='white', edgecolor='none', pad=2)) for txt in clabels]

# Use geocat-viz utility function to configure labels
gv.set_titles_and_labels(ax1, lefttitle="Zonal Wind", lefttitlefontsize=16)

# Label left and right y-axis
ax1.set_ylabel("Pressure (mb)", fontsize=20)

# Format x-axis to show latitudes
lat_formatter = LatitudeFormatter(degree_symbol='')
ax1.xaxis.set_major_formatter(lat_formatter)

# Use geocat-viz utility function to add minor ticks on x-axis
gv.add_major_minor_ticks(ax1, x_minor_per_major=3, y_minor_per_major=0, labelsize=15)

# Add second axis to plot heights (heights chosen arbitrarily)
gv.add_right_hand_axis(
    ax1,
    label="Height (km)",
    ylim=(0, 13),
    yticks=np.array([4, 8]),
    ticklabelsize=15,
    axislabelsize=21,
)

# Turn off tick marks on y-axis, set length and width parameters for x-axis
ax1.tick_params(axis='y', which='minor', left=False, right=False)
ax1.tick_params(axis='x', which='minor', length=4, width=0.6, pad=9)
ax1.tick_params(axis='x', which='major', length=9, width=1, pad=9)

# Use geocat-viz utility function to configure ticks and labels
gv.set_axes_limits_and_ticks(
    ax1,
    ylim=(100000, 20000),
    xticks=np.linspace(-60, 60, 5),
    yticks=np.flip(new_levels),
    xticklabels=None,
    yticklabels=np.flip((new_levels / 100).astype(int)),
)

plt.show()
Total running time of the script: (0 minutes 0.344 seconds)