

Note
Go to the end to download the full example code.
NCL_maponly_1.py#
- This script illustrates the following concepts:
Drawing a cylindrical equidistant map using Cartopy
Adding Cartopy land feature to map
Adding longitude and latitude tick marks
Adding major and minor tick marks
- See following URLs to see the reproduces NCL plot & script:
Original NCL script: https://www.ncl.ucar.edu/Applications/Scripts/maponly_1.ncl
Original NCL plot: https://www.ncl.ucar.edu/Applications/Images/maponly_1_lg.png
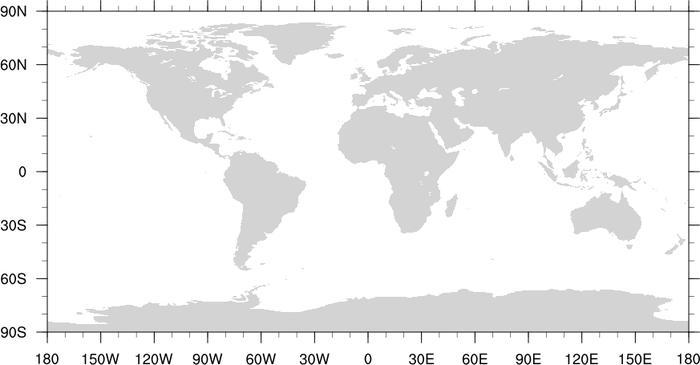
Import packages:
import cartopy.crs as ccrs
import cartopy.feature as cfeature
import matplotlib.pyplot as plt
import numpy as np

import geocat.viz as gv
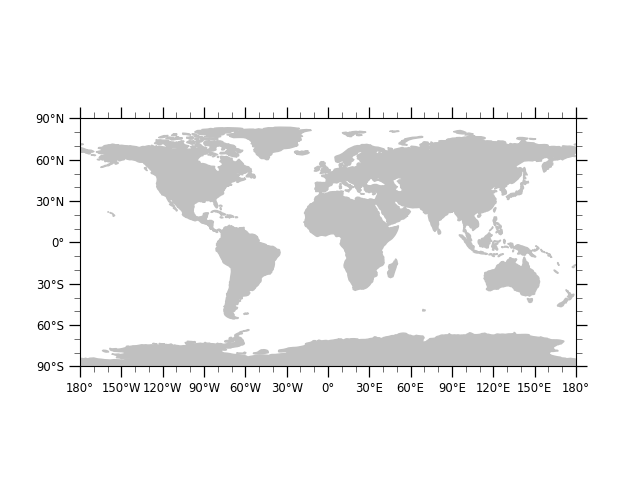
Plot:
# Generate axes using Cartopy
ax = plt.axes(projection=ccrs.PlateCarree())

# Draw land
ax.add_feature(cfeature.LAND, color='silver')

# Use geocat.viz.util convenience function to set axes tick values
gv.set_axes_limits_and_ticks(
    ax, xticks=np.linspace(-180, 180, 13), yticks=np.linspace(-90, 90, 7)
)

# Use geocat.viz.util convenience function to make lat/lon tick labels
gv.add_lat_lon_ticklabels(ax)

# Use geocat.viz.util convenience function to add major and minor tick marks
gv.add_major_minor_ticks(ax)

# Show plot
plt.show()
Total running time of the script: (0 minutes 0.107 seconds)