

Note
Go to the end to download the full example code.
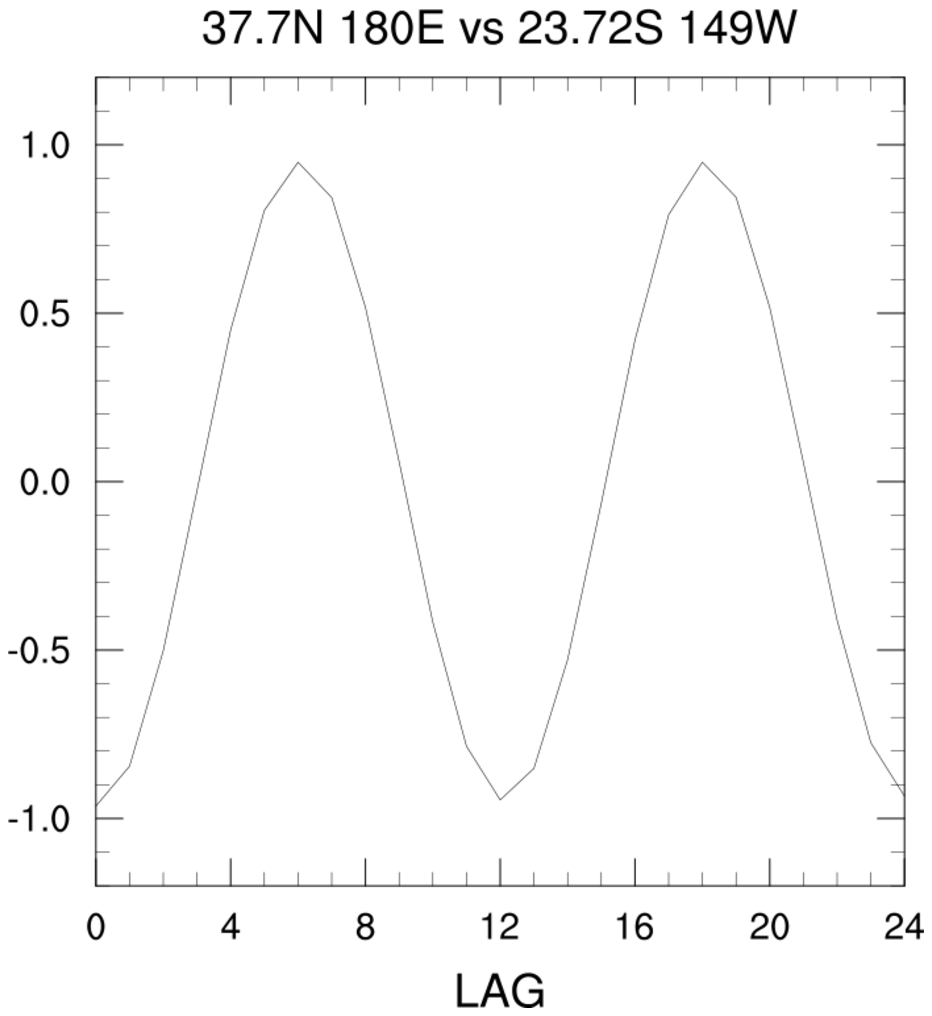
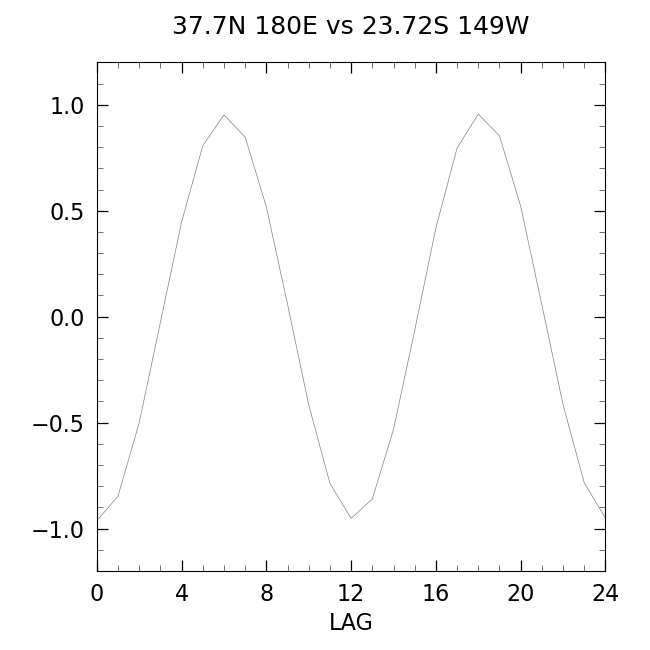
NCL_corel_1.py#
- This script illustrates the following concepts:
Calculating a cross correlation
Generating an equally-spaced span of integers
- See following URLs to see the reproduced NCL plot & script:
Original NCL script: https://www.ncl.ucar.edu/Applications/Scripts/corel_1.ncl
Original NCL plot: https://www.ncl.ucar.edu/Applications/Images/corel_1_lg.png
Import packages:
import numpy as np
import xarray as xr
import matplotlib.pyplot as plt

import geocat.datafiles as gdf
import geocat.viz as gv
Read in data:
# Open a netCDF data file using xarray default engine and load the data into
# xarrays
ds = xr.open_dataset(gdf.get("netcdf_files/b003_TS_200-299.nc"), decode_times=False)

# Extract time series from 3d data
ts = ds.TS
ts1 = ts[:, 45, 64]
ts2 = ts[:, 23, 117]

# Set maximum lag
maxlag = 25

# Generate lag values to define x axis
x = np.arange(0, maxlag, 1)
Create Lead-lag correlation function. This is the equivalent of esccr function in NCL
def LeadLagCorr(A, B, nlags=maxlag):
    """Computes lead lag correlation to compare two series.

    Parameters
    ----------
    A : array_like
        An array containing multiple variables and observations.
    B : array_like
        An array containing multiple variables and observations.
    nlags : int, optional
        The number of lag values. The default is 30.

    Returns
    -------
    coefs : array_like
        An array of size nlags containing the correlation coefficient of each
        lag at each corresponding index of the array.
    """
    coefs = np.empty(nlags)
    coefs[0] = np.corrcoef(A, B)[0, 1]

    for i in range(1, nlags):
        temp_A = A[:-i]
        temp_B = B[i:]

        r = np.corrcoef(temp_A, temp_B)[0, 1]
        coefs[i] = r

    return coefs
Plot:
# Create figure (setting figure size (width,height) in inches) and axes
plt.figure(figsize=(6.5, 6.5))
ax = plt.axes()

ccr = LeadLagCorr(ts1, ts2)

ax.plot(x, ccr, color='gray', linewidth=0.5)

# Use geocat.viz.util convenience function to add minor and major tick lines
gv.add_major_minor_ticks(ax, x_minor_per_major=4, y_minor_per_major=5, labelsize=16)

# Use geocat.viz.util convenience function to set axes parameters without calling several matplotlib functions
# Set axes limits, tick values, and tick labels to show latitude & longitude (i.e. North (N) - South (S))
gv.set_axes_limits_and_ticks(ax, xlim=(0, 24), ylim=(-1.2, 1.2), xticks=x[::4])

# Use geocat.viz.util convenience function to set titles and labels without calling several matplotlib functions
gv.set_titles_and_labels(ax, maintitle="37.7N 180E vs 23.72S 149W", xlabel="LAG")

# Set major and minor tick directions and padding
ax.tick_params(which='both', direction='in', pad=9)

# Set box_layout
ax.set_box_aspect(1)

# Show plot
plt.tight_layout()
plt.show()
Total running time of the script: (0 minutes 0.121 seconds)