

Note
Go to the end to download the full example code.
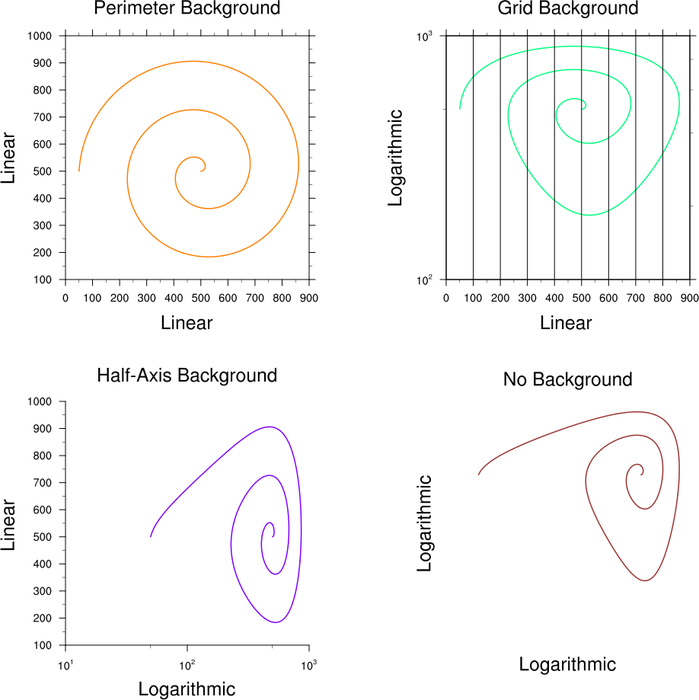
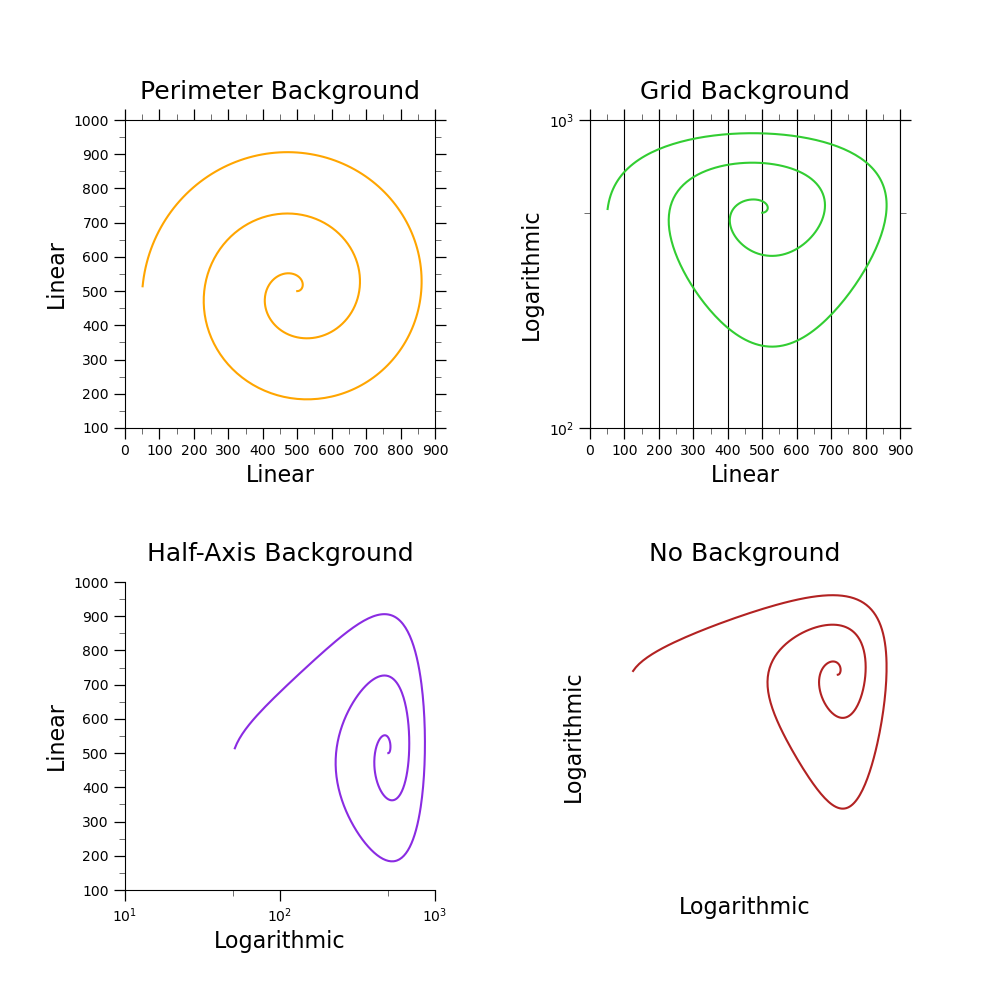
NCL_axes_3.py#
- This script illustrates the following concepts:
Removing the border, tickmarks, and labels from an XY plot
Drawing vertical grid lines on an XY plot
Making an axis logarithmic in an XY plot
Drawing four XY plots in the same figure using matplotlib.subplots
Drawing Y axis labels using exponents
- See following URLs to see the reproduced NCL plot & script:
Original NCL script: https://www.ncl.ucar.edu/Applications/Scripts/axes_3.ncl
Original NCL plots: https://www.ncl.ucar.edu/Applications/Images/axes_3_lg.png
Import packages:
import numpy as np
import matplotlib.pyplot as plt
from matplotlib.ticker import NullFormatter

import geocat.viz as gv
Create dummy data for XY plots
npts = 500

x = 500 + 0.9 * np.arange(0, npts) * np.cos(np.pi / 100 * np.arange(0, npts))
y = 500 + 0.9 * np.arange(0, npts) * np.sin(np.pi / 100 * np.arange(0, npts))
Plot:
# Create subplots
fig, axes = plt.subplots(
    nrows=2, ncols=2, figsize=(10, 10), gridspec_kw=dict(wspace=0.5, hspace=0.5)
)

# Subplot(0, 0): Create plot with linear axes and full perimeter
axes[0][0].plot(x, y, color='orange')

# Use geocat.viz.util convenience function to set titles and labels
gv.set_titles_and_labels(
    axes[0][0], maintitle="Perimeter Background", xlabel="Linear", ylabel="Linear"
)

# Use geocat.viz.util convenience function to add minor and major tick lines
gv.add_major_minor_ticks(
    axes[0][0], x_minor_per_major=2, y_minor_per_major=2, labelsize=10
)

# Use geocat.viz.util convenience function to set axes limits and tick labels
gv.set_axes_limits_and_ticks(
    axes[0][0],
    xlim=(0, 900),
    ylim=(100, 1000),
    xticks=range(0, 901, 100),
    yticks=range(100, 1001, 100),
)

# Subplot(0, 1): Create plot with log y-axis and gridlines
axes[0][1].set_yscale('log')
axes[0][1].plot(x, y, color='limegreen')

# Use geocat.viz.util convenience function to set titles and labels
gv.set_titles_and_labels(
    axes[0][1], maintitle="Grid Background", xlabel="Linear", ylabel="Logarithmic"
)

# Use geocat.viz.util convenience function to add minor and major tick lines
gv.add_major_minor_ticks(
    axes[0][1], x_minor_per_major=2, y_minor_per_major=2, labelsize=10
)

# Use geocat.viz.util convenience function to set axes limits and tick labels
gv.set_axes_limits_and_ticks(
    axes[0][1], xlim=(0, 900), ylim=(100, 1000), xticks=range(0, 901, 100)
)

# Remove labels for minor ticks on log scale
axes[0][1].yaxis.set_minor_formatter(NullFormatter())

# Turn on vertical gridlines
axes[0][1].grid(True, which='major', axis='x', color='black')

# Subplot(1, 0): Create plot with log x-axis and half-axis background
axes[1][0].set_xscale('log')
axes[1][0].plot(x, y, color='blueviolet')

# Use geocat.viz.util convenience function to set titles and labels
gv.set_titles_and_labels(
    axes[1][0], maintitle="Half-Axis Background", xlabel="Logarithmic", ylabel="Linear"
)

# Use geocat.viz.util convenience function to add minor and major tick lines
gv.add_major_minor_ticks(
    axes[1][0], x_minor_per_major=2, y_minor_per_major=2, labelsize=10
)

# Use geocat.viz.util convenience function to set axes limits and tick labels
gv.set_axes_limits_and_ticks(
    axes[1][0], xlim=(10, 1000), ylim=(100, 1000), yticks=range(100, 1001, 100)
)

# Remove labels for minor ticks on log scale
axes[1][0].xaxis.set_minor_formatter(NullFormatter())

# Hide the top and right side borders
axes[1][0].spines['right'].set_visible(False)
axes[1][0].spines['top'].set_visible(False)

# Hide the top and right side tick marks
axes[1][0].yaxis.set_ticks_position('left')
axes[1][0].xaxis.set_ticks_position('bottom')

# Subplot(1, 1) Create plot with log axes and no background
axes[1][1].set_xscale('log')
axes[1][1].set_yscale('log')
axes[1][1].plot(x, y, color='firebrick')

# Use geocat.viz.util convenience function to set titles and labels
gv.set_titles_and_labels(
    axes[1][1], maintitle="No Background", xlabel="Logarithmic", ylabel="Logarithmic"
)

# Use geocat.viz.util convenience function to set axes limits and tick labels
gv.set_axes_limits_and_ticks(axes[1][1], xlim=(31.628, 1000), ylim=(100, 1000))

# Remove the border
axes[1][1].set_frame_on(False)

# Remove all tick marks and their labels
axes[1][1].tick_params(
    which='both',
    top=False,
    bottom=False,
    left=False,
    right=False,
    labeltop=False,
    labelbottom=False,
    labelleft=False,
    labelright=False,
)

# Show plot
plt.show()
Total running time of the script: (0 minutes 0.211 seconds)