

Note
Go to the end to download the full example code.
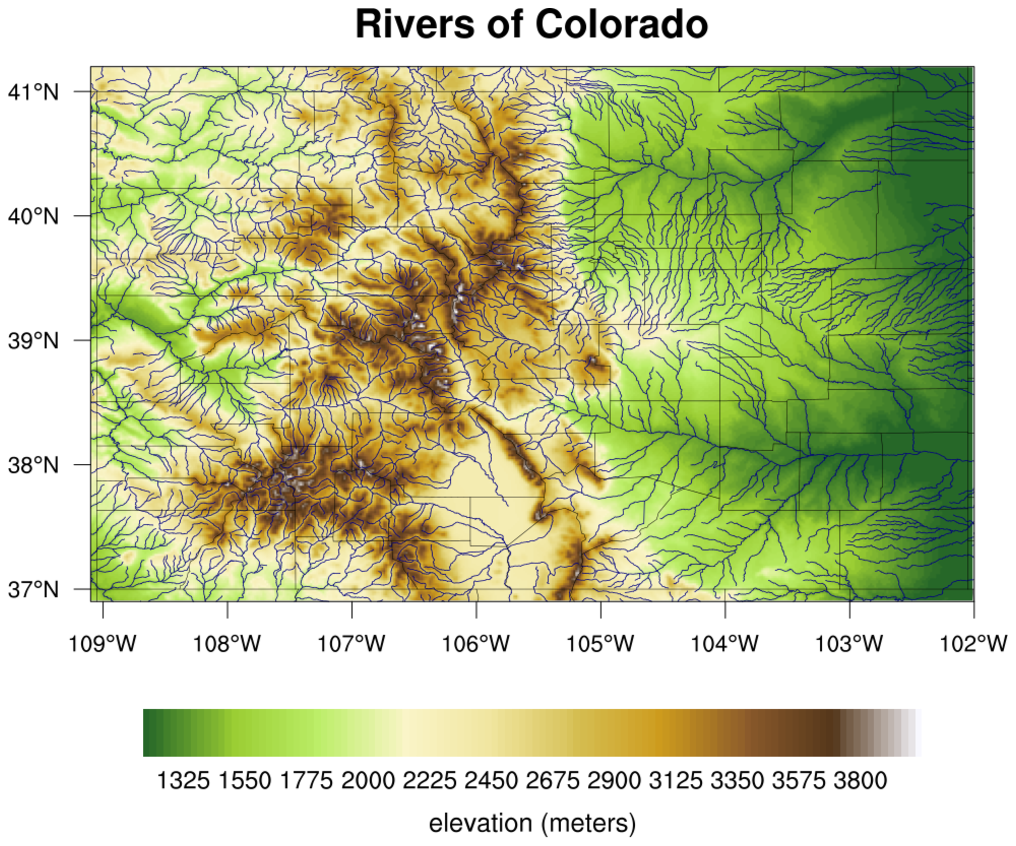
NCL_topo_8.py#
- This script illustrates the following concepts:
Drawing a topographic map using 1’ data
Drawing topographic data using an NCL colormap
Working with shapefiles
- See following URLs to see the reproduced NCL plot & script:
Original NCL script: https://www.ncl.ucar.edu/Applications/Scripts/topo_8.ncl
Original NCL plot: https://www.ncl.ucar.edu/Applications/Images/topo_8_lg.png
Import packages:
import matplotlib.pyplot as plt
import xarray as xr
import numpy as np
import cartopy.crs as ccrs
import cartopy.io.shapereader as shpreader
import cartopy.feature as cfeature
import cmaps

import geocat.viz as gv
import geocat.datafiles as gdf
Read in data:
# Open a netcdf data file using xarray
ds = xr.open_dataset(gdf.get('netcdf_files/colorado_elev.nc'))

# Select elevation data
ds = ds.z

# Open shapefile of US counties
open(gdf.get("shape_files/countyl010g.dbf"), 'r')
open(gdf.get("shape_files/countyl010g.shp"), 'r')
open(gdf.get("shape_files/countyl010g.shx"), 'r')
open(gdf.get("shape_files/countyl010g.prj"), 'r')
shapefile_counties = shpreader.Reader(gdf.get("shape_files/countyl010g.shp"))

# Open shapefile of all rivers. This data can be downloaded from `NOAA: <https://www.weather.gov/gis/Rivers>`_
open(gdf.get("shape_files/rv16my07.dbf"), 'r')
open(gdf.get("shape_files/rv16my07.shx"), 'r')
open(gdf.get("shape_files/rv16my07.shp"), 'r')
open(gdf.get("shape_files/rv16my07.prj"), 'r')
shapefile_rivers = shpreader.Reader(gdf.get("shape_files/rv16my07.shp"))
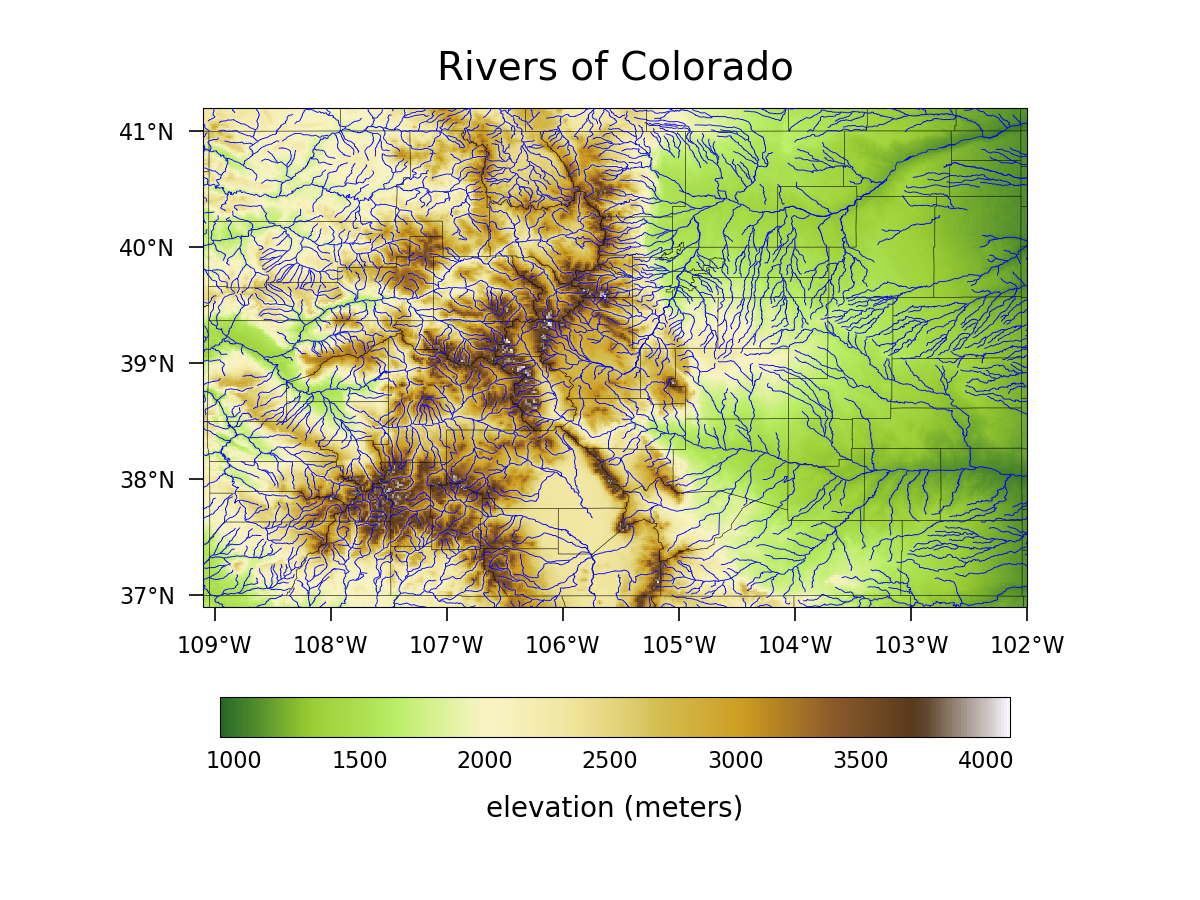
Plot:
# Generate figure and set size
plt.figure(figsize=(12, 9))

# Generate axes, using Cartopy
projection = ccrs.PlateCarree()
ax = plt.axes(projection=projection)

# Select NCL colormap and truncate to remove blue from lower end
cmap = cmaps.OceanLakeLandSnow
newcmap = gv.truncate_colormap(cmap=cmap, minval=0.01, maxval=1)

# Plot the elevation data
elev = ds.plot.imshow(ax=ax, transform=projection, cmap=newcmap, add_colorbar=False)

# Add colorbar
cbar = plt.colorbar(
    ax=ax, mappable=elev, orientation='horizontal', pad=0.13, shrink=0.85
)
cbar.ax.tick_params(size=0)  # Remove tick marks from colorbar
cbar.ax.xaxis.set_tick_params(
    pad=10, labelsize=16
)  # Pad between colorbar and tick labels
cbar.set_label("elevation (meters)", fontsize=20, labelpad=15)  # Add colorbar label

# Add counties
counties = list(shapefile_counties.geometries())
COUNTIES = cfeature.ShapelyFeature(counties, ccrs.PlateCarree())
ax.add_feature(COUNTIES, facecolor='none', edgecolor='black', linewidth=0.4, zorder=5)

# Add rivers
rivers = list(shapefile_rivers.geometries())
RIVERS = cfeature.ShapelyFeature(rivers, ccrs.PlateCarree())
ax.add_feature(RIVERS, facecolor='none', edgecolor='blue', linewidth=0.6, zorder=6)

# Use geocat-viz utility function to customize titles and labels
gv.set_titles_and_labels(
    ax, xlabel="", ylabel="", maintitle="Rivers of Colorado", maintitlefontsize=28
)

# Use geocat-viz utility function to format x and y axes
gv.set_axes_limits_and_ticks(
    ax,
    xlim=[-109.1, -102],
    ylim=[36.9, 41.2],
    xticks=np.arange(-109, 102),
    yticks=np.arange(37, 42),
)

# Customize ticks and labels
ax.tick_params(length=10, width=1.2, labelsize=16, pad=10)

# Use geocat-viz utility function to add lat/lon formatting for tick labels
gv.add_lat_lon_ticklabels(ax)

# Show the plot
plt.show()
/home/docs/checkouts/readthedocs.org/user_builds/geocat-examples/conda/latest/lib/python3.14/site-packages/geocat/viz/util.py:746: UserWarning: Overwriting the cmap 'trunc(OceanLakeLandSnow,0.01,1.00)' that was already in the registry.
  mpl.colormaps.register(new_cmap, force=force)
Total running time of the script: (0 minutes 14.425 seconds)