

Note
Go to the end to download the full example code.
NCL_regress_1.py#
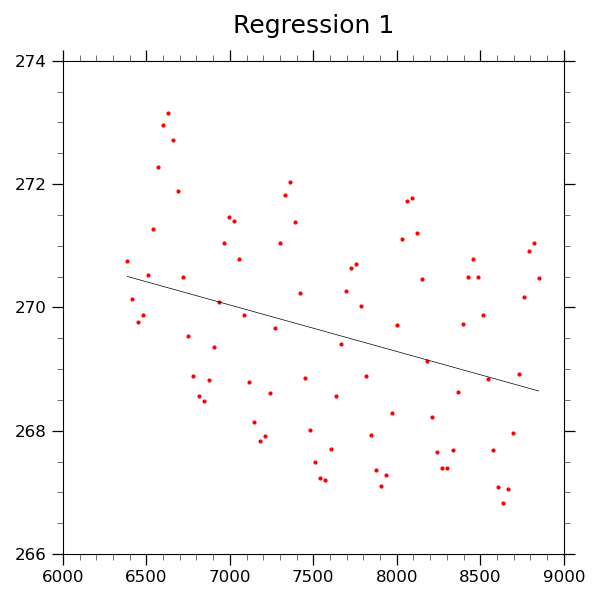
- This script illustrates the following concepts:
Read tabular values from an ascii file
Calculating the least squared regression for a one dimensional array
Drawing a scatter plot with a regression line
Changing the size and color of markers, thickness of line
- See following URLs to see the reproduced NCL plot & script:
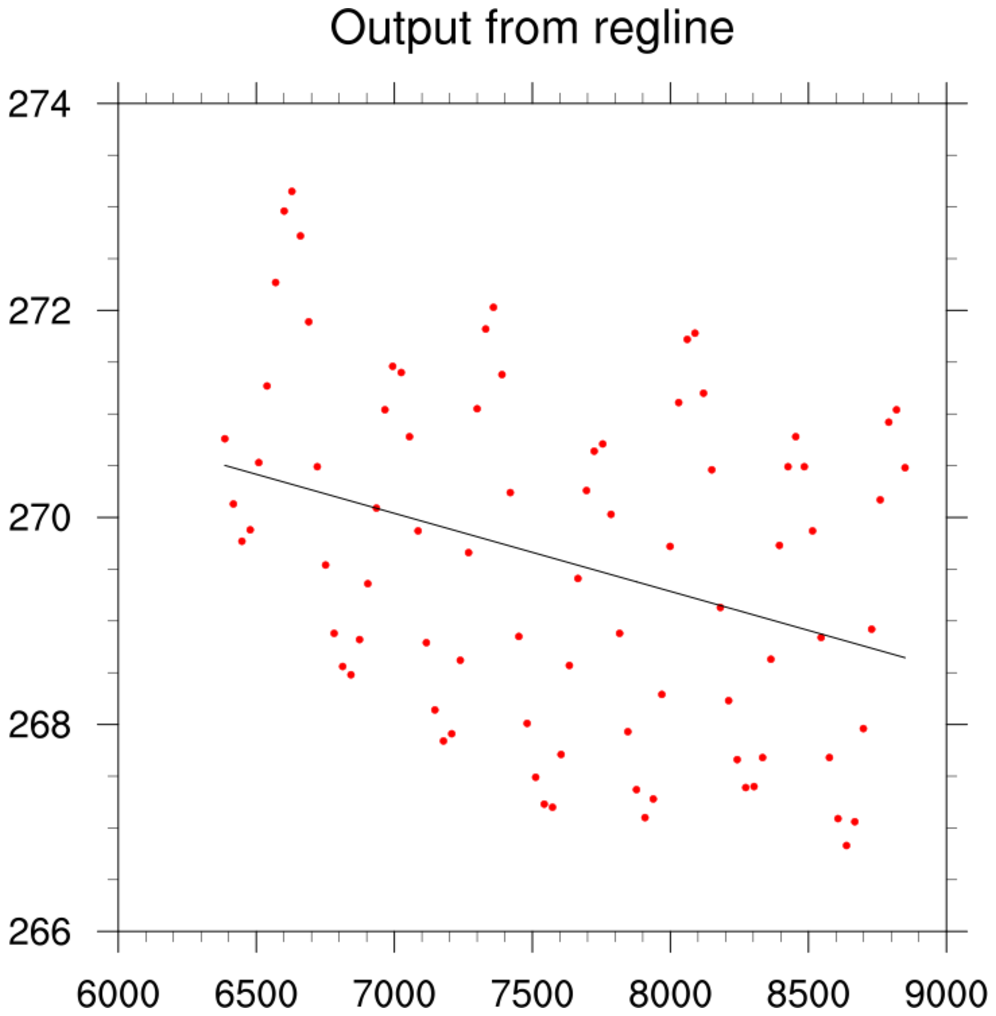
Original NCL script: https://www.ncl.ucar.edu/Applications/Scripts/regress_1.ncl
Original NCL plots: https://www.ncl.ucar.edu/Applications/Images/regress_1_lg.png
Import packages
import numpy as np
import matplotlib.pyplot as plt

import geocat.datafiles as gdf
import geocat.viz as gv
Read in data:
# Open a ascii data file using numpy's loadtxt
# Specify the delimiter from the file
# Read in the data as a floats
x, y = np.loadtxt(
    gdf.get("ascii_files/regress_1.txt"), delimiter=',', unpack=True, dtype=float
)
Calculate regression:
# Use numpy's polyfit to calculate a linear regression
# This function outputs [a, b], where y = ax + b in the regression fit
[a, b] = np.polyfit(x, y, 1)
Transform the found regression model for plotting
# Now that we have a y = ax + b, we can evaluate this model over a range,
# which will give us points to plot
x_regress = range(int(min(x)), int(max(x)))
y_regress = a * x_regress + b
Plot
# Generate figure (set its size (width, height) in inches) and axes
plt.figure(figsize=(6, 6))
ax = plt.gca()

# Plot original data
# Note that the s parameter sets the size of the markers in pts
plt.scatter(x, y, color='red', s=4)

# Plot regression
plt.plot(x_regress, y_regress, color='black', linewidth=0.5)

# specify X and Y axis limits
plt.xlim([6000, 9000])
plt.ylim([266, 274])

# Use geocat.viz utility functions to add a main title
gv.set_titles_and_labels(ax=ax, maintitle="Regression 1")

# Use geocat.viz.util convenience function to add minor and major tick lines
gv.add_major_minor_ticks(ax, x_minor_per_major=5, y_minor_per_major=4, labelsize=12)

# Use geocat.viz.util convenience function to set axes parameters
gv.set_axes_limits_and_ticks(
    ax,
    xlim=(6000, 9000),
    xticks=np.arange(6000, 9001, 500),
    ylim=(266, 274),
    yticks=np.arange(266, 275, 2),
)

# Show plot
plt.tight_layout()
plt.show()
Total running time of the script: (0 minutes 0.396 seconds)