

Note
Go to the end to download the full example code.
NCL_dataonmap_10.py#
- This script illustrates the following concepts:
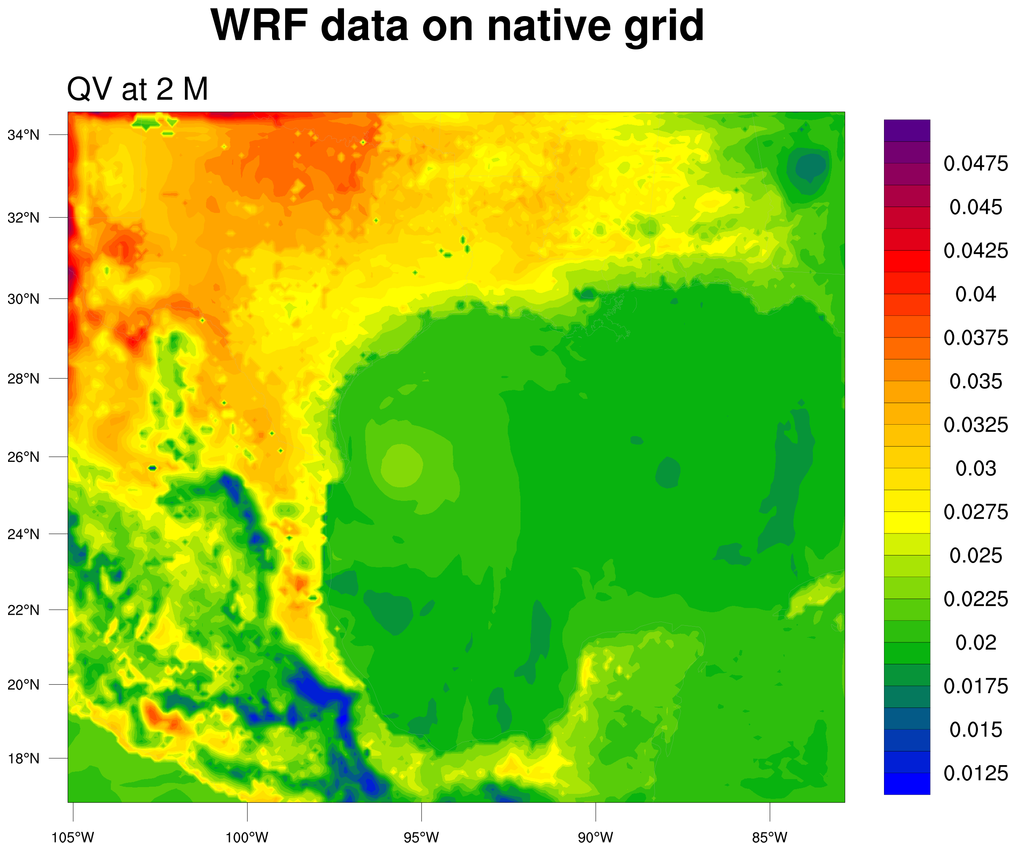
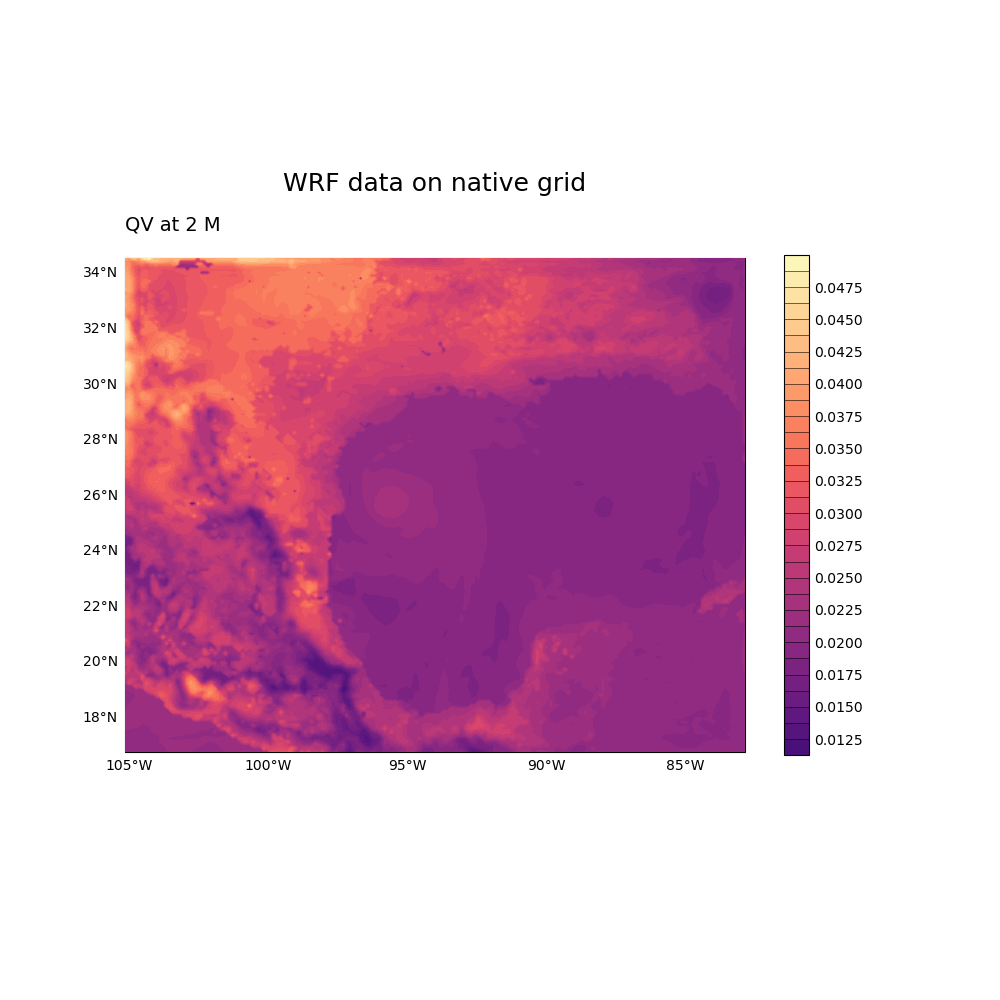
Plotting WRF data on native grid
Plotting data using wrf python functions
Overlaying continent outlines on a map
Following best practices when choosing a colormap. More information on colormap best practices can be found here.
- See following URLs to see the reproduced NCL plot & script:
Original NCL script: https://www.ncl.ucar.edu/Applications/Scripts/dataonmap_10.ncl
Original NCL plot: https://www.ncl.ucar.edu/Applications/Images/dataonmap_10_1_lg.png
Import packages
from netCDF4 import Dataset
import numpy as np
import matplotlib.pyplot as plt
import matplotlib.ticker as mticker
import cartopy.crs as ccrs
from wrf import getvar, to_np, latlon_coords

import geocat.datafiles as gdf
import geocat.viz as gv
Read in the data
wrfin = Dataset(
    gdf.get("netcdf_files/wrfout_d01_2003-07-15_00_00_00"), decode_times=True
)
q2 = getvar(wrfin, "Q2")
Plot the data
# Get the latitude and longitude coordinate. This is usually needed for plotting.
lats, lons = latlon_coords(q2)

# Generate figure (set its size (width, height) in inches)
fig = plt.figure(figsize=(10, 10))

# Generate axes using Cartopy
ax = plt.axes(projection=ccrs.PlateCarree())

# Add filled contours
plt.contourf(
    to_np(lons),
    to_np(lats),
    q2,
    levels=np.linspace(0.01125, 0.05, 32),
    cmap="magma",
    vmin=0,
    vmax=0.05,
    zorder=4,
)

# Add a colorbar
cbar = plt.colorbar(
    ax=ax,
    orientation="vertical",
    ticks=np.arange(0.0125, 0.0476, 0.0025),
    drawedges=True,
    extendrect=True,
    shrink=0.65,
)

# Format colorbar ticks and labels
cbar.ax.tick_params(size=0, labelsize=10)

# Draw gridlines
gl = ax.gridlines(
    crs=ccrs.PlateCarree(),
    draw_labels=True,
    dms=False,
    x_inline=False,
    y_inline=False,
    linewidth=1,
    color="k",
    alpha=0.25,
    zorder=4,
)

# Manipulate latitude and longitude gridline numbers and spacing
gl.top_labels = False
gl.right_labels = False
gl.xlocator = mticker.FixedLocator(np.arange(-105, -80, 5))
gl.ylocator = mticker.FixedLocator(np.arange(18, 35, 2))
gl.xlabel_style = {"rotation": 0, "size": 10}
gl.ylabel_style = {"rotation": 0, "size": 10}
gl.xlines = True
gl.ylines = True

# Add titles and labels to projection
gv.set_titles_and_labels(
    ax,
    maintitle="WRF data on native grid",
    lefttitle="QV at 2 M",
    maintitlefontsize=16,
    lefttitlefontsize=14,
)

plt.show()
Total running time of the script: (0 minutes 0.408 seconds)