

Note
Go to the end to download the full example code.
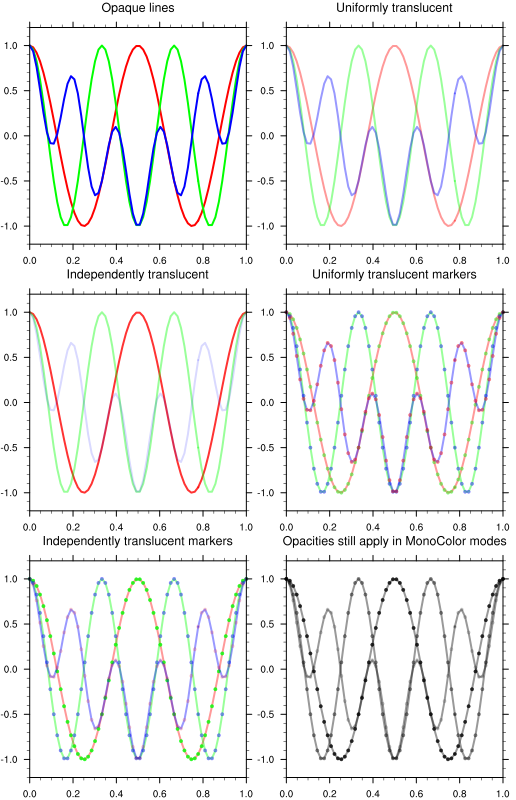
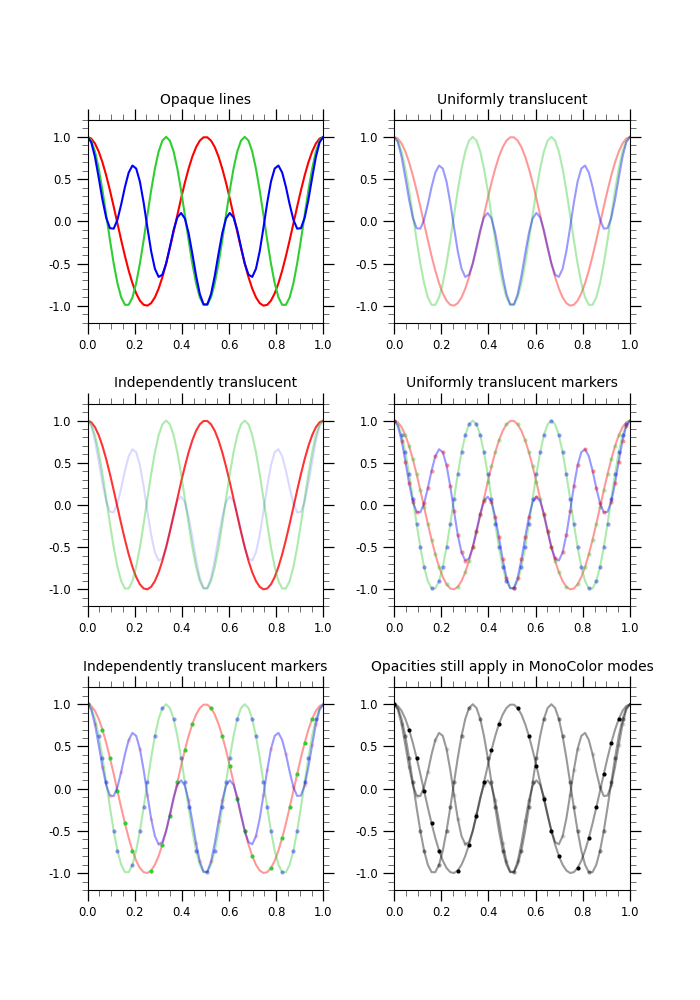
NCL_xy_35.py#
- This script illustrates the following concepts:
Use of opacity resources to control opacity of curves and markers in XYPlots.
How to set line opacity and marker opacity to different values using RGBA tuples
Opacity is still functional in colorless plots
- See following URLs to see the reproduced NCL plot & script:
Original NCL script: https://www.ncl.ucar.edu/Applications/Scripts/xy_35.ncl
Original NCL plot: https://www.ncl.ucar.edu/Applications/Images/xy_35_lg.png
Import packages:
import numpy as np
from matplotlib import pyplot as plt
from matplotlib import colors

import geocat.viz as gv
Create data:
# Make array of x-values, 64 evenly spaced values between 0 and 1
f = np.linspace(0.0, 1.0, 64)

twopi = 2 * np.pi

# Create three arrays of y-values to be plotted
x = np.cos(f * 2 * twopi)
y = np.cos(f * 3 * twopi)
z = x * y
Plot:
# Create figure with 6 axes
fig, axes = plt.subplots(figsize=(7, 10), nrows=3, ncols=2)
plt.subplots_adjust(wspace=0.3, hspace=0.4)

# Plot first graph
axesList = [axes[0, 0], axes[0, 1], axes[1, 0], axes[1, 1], axes[2, 0], axes[2, 1]]

# Create array of titles of each plot
titles = [
    'Opaque lines',
    'Uniformly translucent',
    'Independently translucent',
    'Uniformly translucent markers',
    'Independently translucent markers',
    'Opacities still apply in MonoColor modes',
]

# Create ticks, axis limits, and titles for each of the 6 plots
for ax in range(6):
    # Use geocat-viz function to set main title of plot
    gv.set_titles_and_labels(axesList[ax], maintitle=titles[ax], maintitlefontsize=10)

    # Use geocat-viz function to set limits and tick locations on x and y axes
    gv.set_axes_limits_and_ticks(
        axesList[ax],
        xlim=[0, 1],
        ylim=[-1.2, 1.2],
        yticks=np.arange(-1.5, 1.5, 0.5),
        yticklabels=np.arange(-1.5, 1.5, 0.5),
    )

    # Use geocat-viz function to add major and minor ticks on the x and y axes
    gv.add_major_minor_ticks(
        axesList[ax], x_minor_per_major=4, y_minor_per_major=5, labelsize="small"
    )

# Set standard alpha (transparency) value
alpha = 0.4

# Plot first graph:

# Plot x, y, and z lines
line1 = axesList[0].plot(f, x, color='red')
line2 = axesList[0].plot(f, y, color='limegreen')
line3 = axesList[0].plot(f, z, color='blue')

# Plot second graph:

# Plot x, y, and z lines with the same level of transparency
line1 = axesList[1].plot(f, x, color='red', alpha=alpha)
line2 = axesList[1].plot(f, y, color='limegreen', alpha=alpha)
line3 = axesList[1].plot(f, z, color='blue', alpha=alpha)

# Plot third graph:

# Plot x, y, and z lines with varying transparencies
line1 = axesList[2].plot(f, x, color='red', alpha=0.8)
line2 = axesList[2].plot(f, y, color='limegreen', alpha=0.4)
line3 = axesList[2].plot(f, z, color='blue', alpha=0.15)

# Plot fourth graph:

# Plot x, y, and z lines and markers with same level of transparency
# 'ms' is the marker size
# 'markevery' allows you to place a marker every num steps in the x direction
# 'mec' is marker edge color
# 'mfc' is marker face color
line1 = axesList[3].plot(
    f,
    x,
    'o',
    ls='-',
    color='red',
    alpha=alpha,
    ms=3,
    markevery=0.05,
    mec='None',
    mfc='limegreen',
)
line2 = axesList[3].plot(
    f,
    y,
    'o',
    ls='-',
    color='limegreen',
    alpha=alpha,
    ms=3,
    markevery=0.05,
    mec='None',
    mfc='blue',
)
line3 = axesList[3].plot(
    f,
    z,
    'o',
    ls='-',
    color='blue',
    alpha=alpha,
    ms=3,
    markevery=0.05,
    mec='None',
    mfc='red',
)

# Plot fifth graph:

# Create RGBA tuples for lines
lcolor1 = colors.to_rgba('red', alpha=alpha)
lcolor2 = colors.to_rgba('limegreen', alpha=alpha)
lcolor3 = colors.to_rgba('blue', alpha=alpha)

# Create RGBA tuples for markers
mcolor1 = colors.to_rgba('limegreen', alpha=1.0)
mcolor2 = colors.to_rgba('blue', alpha=0.4)
mcolor3 = colors.to_rgba('red', alpha=0.15)

# Plot x, y, and z lines and markers- the lines have the same
# transparency level, but the markers vary in alpha value
line1 = axesList[4].plot(
    f, x, 'o', ls='-', color=lcolor1, ms=3, markevery=0.1, mec='None', mfc=mcolor1
)
line2 = axesList[4].plot(
    f, y, 'o', ls='-', color=lcolor2, ms=3, markevery=0.1, mec='None', mfc=mcolor2
)
line3 = axesList[4].plot(
    f, z, 'o', ls='-', color=lcolor3, ms=3, markevery=0.1, mec='None', mfc=mcolor3
)

# Plot sixth graph:

# Create RGBA tuples for lines
lcolor1 = colors.to_rgba('black', alpha=alpha)
lcolor2 = colors.to_rgba('black', alpha=alpha)
lcolor3 = colors.to_rgba('black', alpha=alpha)

# Create RGBA tuples for markers
mcolor1 = colors.to_rgba('black', alpha=1.0)
mcolor2 = colors.to_rgba('black', alpha=0.4)
mcolor3 = colors.to_rgba('black', alpha=0.15)

# Plot x, y, and z lines and markers in black- the lines have the same
# transparency level, but the markers vary in alpha value
line1 = axesList[5].plot(
    f, x, 'o', ls='-', color=lcolor1, ms=3, markevery=0.1, mec='None', mfc=mcolor1
)
line2 = axesList[5].plot(
    f, y, 'o', ls='-', color=lcolor2, ms=3, markevery=0.1, mec='None', mfc=mcolor2
)
line3 = axesList[5].plot(
    f, z, 'o', ls='-', color=lcolor3, ms=3, markevery=0.1, mec='None', mfc=mcolor3
)

plt.show()
Total running time of the script: (0 minutes 0.378 seconds)