

Note
Go to the end to download the full example code.
NCL_tm_2.py#
Tickmark and Axis Manipulation example
Note: This script is aimed at demonstrating the explicit handling of tick marks, their locations, labels, etc.; therefore, the use of geocat-viz convenience functions is minimized here to show such tick management functions directly throughout this script.
- This script illustrates the following concepts:
Explicitly setting tickmarks and labels on the bottom X axis
Setting the spacing for tickmarks
Setting the minimum/maximum value of the Y axis in an XY plot
Changing the width and height of a plot
- See following URLs to see the reproduced NCL plot & script:
Original NCL script: https://www.ncl.ucar.edu/Applications/Scripts/tm_2.ncl
Original NCL plot: https://www.ncl.ucar.edu/Applications/Images/tm_1_1_lg.png and https://www.ncl.ucar.edu/Applications/Images/tm_1_2_lg.png
Import packages:
import numpy as np
import matplotlib.pyplot as plt
from matplotlib.ticker import MultipleLocator, FormatStrFormatter

import geocat.viz as gv
Generate data:
# Note that range() top value is not included in the returned array of values.

x_data = np.arange(1950, 2006)
y_data = np.random.uniform(-4, 4, 56)

# Print out a formatted message; note the starting 'f' for the string.
print(f"There are {len(x_data)} values in x_data, and {len(y_data)} values in y_data.")
There are 56 values in x_data, and 56 values in y_data.
Plot:
# Generate figure and set its size (width, height) in inches.
plt.figure(1, figsize=(8, 6))
# Make a subplot with major ticks that are multiples of 5.
# Create a subplot grid with two rows and one column (stacked subplots), and
# set the current plot context to the top subplot.
ax1 = plt.subplot(2, 1, 1)
# Format the tick labels. Use integers for the major ticks.
# For the minor ticks, use no labels; defaults to NullFormatter.
ax1.xaxis.set_major_formatter(FormatStrFormatter('%d'))
ax1.yaxis.set_major_formatter(FormatStrFormatter('%.1f'))
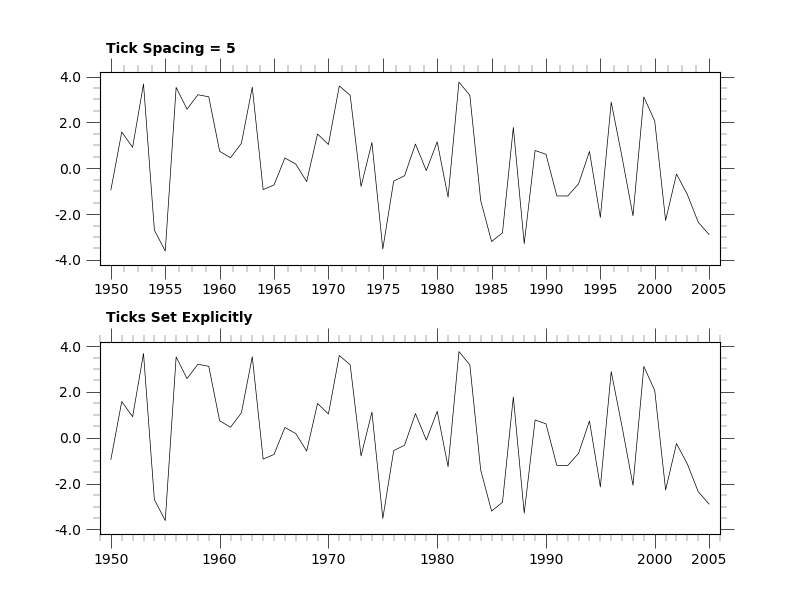
# Set the major tick spacing.
major_tick_spacing = 5
ax1.xaxis.set_major_locator(MultipleLocator(major_tick_spacing))
spacingString = f'Tick Spacing = {major_tick_spacing}'
# Draw ticks on all sides of the plot.
plt.tick_params(which='both', top=True, right=True)
# Increase the length of the tick marks.
plt.tick_params(which='major', length=10.0, width=0.5)
plt.tick_params(which='minor', length=5.0, width=0.25)
# Set the minor tick spacing for X and Y axes.
ax1.xaxis.set_minor_locator(MultipleLocator(1.25))
ax1.yaxis.set_minor_locator(MultipleLocator(0.5))
# Add a descriptive string to the top left corner of the plot.
ax1.text(0.01, 1.1, spacingString, transform=ax1.transAxes, fontweight='bold')
# Plot data and set the X axis limits.
plt.plot(x_data, y_data, color='black', linewidth=0.5)
# Usa geocat.viz.util convenience function to set axes parameters without calling several matplotlib functions
# Set axes limits
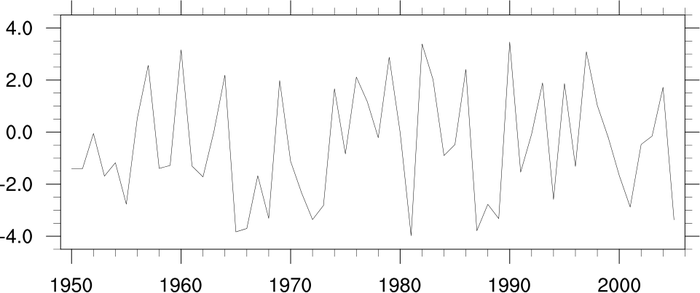
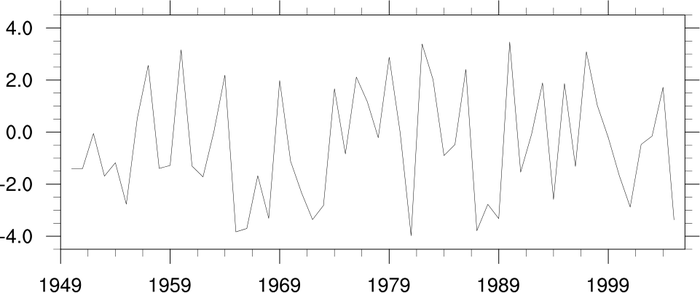
gv.set_axes_limits_and_ticks(ax1, xlim=(1949, 2006), ylim=(-4.2, 4.2))
# Make a subplot with major ticks that are set to explicit values and minor ticks that are multiples of 1.
# Set the current plot context to the bottom subplot.
ax2 = plt.subplot(2, 1, 2)
# Format the tick labels.
# For the minor ticks, use no labels; defaults to NullFormatter.
ax2.xaxis.set_major_formatter(FormatStrFormatter('%d'))
ax2.yaxis.set_major_formatter(FormatStrFormatter('%.1f'))
# Draw ticks on all sides of the plot.
plt.tick_params(which='both', top=True, right=True)
# Increase the length of the tick marks.
plt.tick_params(which='major', length=10.0, width=0.5)
plt.tick_params(which='minor', length=5.0, width=0.25)
# Set the minor tick spacing for X and Y axes.
ax2.xaxis.set_minor_locator(MultipleLocator(1))
ax2.yaxis.set_minor_locator(MultipleLocator(0.5))
# Add a descriptive text to the top left corner of the axes.
ax2.text(0.01, 1.1, "Ticks Set Explicitly", transform=ax2.transAxes, fontweight='bold')
# Line-plot data
plt.plot(x_data, y_data, color='black', linewidth=0.5)
# Use geocat.viz.util convenience function to set axes parameters without calling several matplotlib functions
# Set axes limits, and tick values on x-axes.
gv.set_axes_limits_and_ticks(
ax2,
xlim=(1949, 2006),
ylim=(-4.2, 4.2),
xticks=[1950, 1960, 1970, 1980, 1990, 2000, 2005],
)
# Create more space between subplots
plt.subplots_adjust(hspace=0.4)
# Show the plot
plt.show()
Total running time of the script: (0 minutes 0.178 seconds)