

Note
Go to the end to download the full example code.
CB_Temperature.py#
This script illustrates multiple color schemes for color maps which will allow for those impacted by color blindness to see visualizations. Using rainbow color schemes is also a poor choice in color scheme for images that may be transferred to a black and white scale for printing. This code addresses a handful of options to use in place of rainbow color schemes for use in the matplotlib.pyplot library.
- More information on this subject can be found here:
- More color schemes can be found here:
- See following URL to see the reproduced plot & script from the GeoCAT examples gallery:
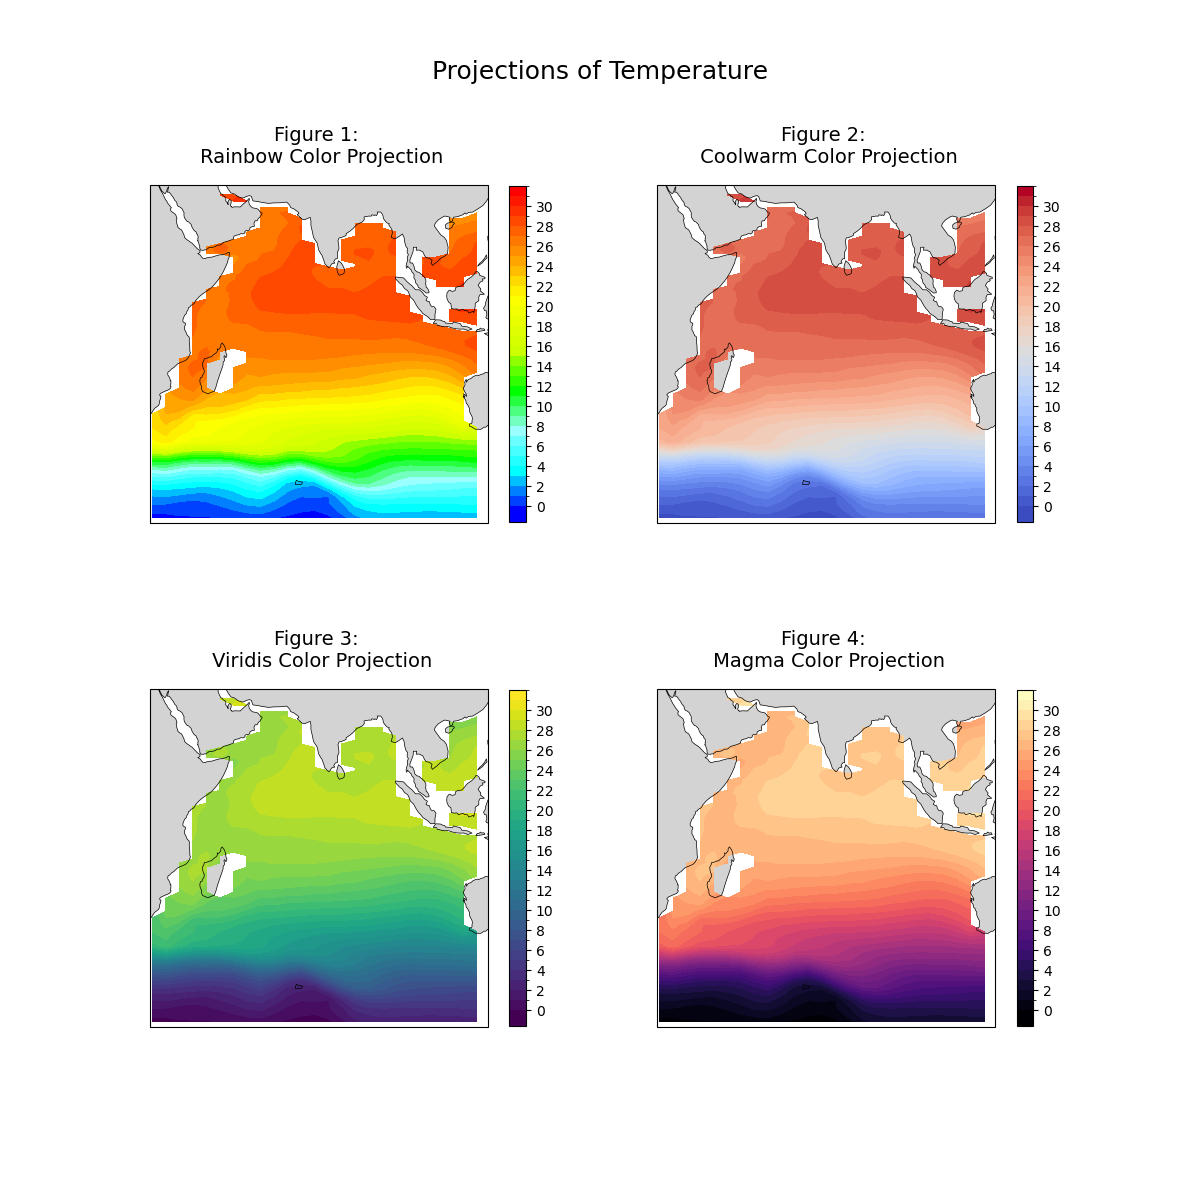
- Figure 1.
The rainbow color scheme is problematic due to the lack of a natural perceived ordering of colors, perceptual changes in the colors (ex: yellow and green blend together easily), and is sensitive to deficiencies in vision
- Figure 2.
The coolwarm diverging scheme should be used when both high and low values are interesting. However, be careful using this scheme if the projection will be printed to black and white.
- Figure 3.
This is an example of a less distinct contrasting color gradient. This choice in color scheme would be a good choice for printing in black and white but may create some challenges for individuals who experience blue-green colorblindness.
- Figure 4.
This plot shows how drastically contrasting colors can be incredibly useful for plotting this type of data. This color scheme will work well for color blind impacted individuals and is black and white print friendly.
Import packages:
import cartopy.crs as ccrs
import cartopy.feature as cfeature
import matplotlib.pyplot as plt
import numpy as np
import xarray as xr

import geocat.datafiles as gdf
import cmaps
import geocat.viz as gv
Read in data:
# Open a netCDF data file using xarray default engine and load the data into xarrays
ds = xr.open_dataset(gdf.get("netcdf_files/h_avg_Y0191_D000.00.nc"), decode_times=False)

# Extract a slice of the data
t = ds.T.isel(time=0, z_t=0).sel(lat_t=slice(-60, 30), lon_t=slice(30, 120))
Plot:
fig = plt.figure(figsize=(12, 12))


def Plot(color, row, col, pos, title):
    # Generate axes, using Cartopy, drawing coastlines, and adding features
    projection = ccrs.PlateCarree()
    ax1 = plt.subplot(row, col, pos, projection=projection)
    ax1.coastlines(linewidths=0.5)
    ax1.add_feature(cfeature.LAND, facecolor="lightgray")

    # Import an NCL colormap
    newcmp = color

    # Contourf-plot data
    temp = t.plot.contourf(
        ax=ax1,
        transform=projection,
        levels=33,
        vmin=0,
        vmax=32,
        cmap=newcmp,
        add_colorbar=False,
    )

    # Add color bar
    cbar_ticks = np.arange(0, 32, 2)
    cbar = plt.colorbar(
        temp,
        orientation='vertical',
        shrink=0.8,
        pad=0.05,
        extendrect=True,
        ticks=cbar_ticks,
    )

    cbar.ax.tick_params(labelsize=10)

    # Use geocat.viz.util convenience function to set axes parameters without calling several matplotlib functions
    # Set axes limits, and tick values
    gv.set_axes_limits_and_ticks(ax1, xlim=(30, 120), ylim=(-60, 30))

    # Use geocat.viz.util convenience function to set titles and labels without calling several matplotlib functions
    gv.set_titles_and_labels(
        ax1, maintitle=title, maintitlefontsize=14, xlabel="", ylabel=""
    )


# Plot first color map
Plot(cmaps.BlAqGrYeOrRe, 2, 2, 1, "Figure 1: \n Rainbow Color Projection")

# plot second color map
Plot("coolwarm", 2, 2, 2, "Figure 2: \n Coolwarm Color Projection")

# plot third color map
Plot("viridis", 2, 2, 3, "Figure 3: \n Viridis Color Projection")

# Plot fourth color map
Plot("magma", 2, 2, 4, "Figure 4: \n Magma Color Projection")

fig.suptitle("Projections of Temperature", x=0.5, y=0.95, fontsize=18)
Text(0.5, 0.95, 'Projections of Temperature')
Total running time of the script: (0 minutes 1.242 seconds)