

Note
Go to the end to download the full example code.
NCL_station_3.py#
- This script illustrates the following concepts:
Drawing station numbers on a map, and removing ones that overlap
Attaching lots of text strings to a map
Using Cartopy’s GeoAxes.gridlines as a workaround to adding tick labels on Axes with Mercator (or another) map projection
- See following URLs to see the reproduced NCL plot & script:
Import packages:
import numpy as np
import pandas as pd
import cartopy.crs as ccrs
import cartopy.feature as cfeature
from matplotlib import pyplot as plt
import matplotlib.ticker as mticker

import geocat.datafiles as gdf
Read in data:
# Open a ascii data file using pandas read_csv and assigning column names
ds = pd.read_csv(
    gdf.get('ascii_files/istasyontablosu_son.txt'),
    delimiter='\\s+',
    names=['index', 'station', 'year1', 'year2', 'number', 'lat', 'lon'],
)

# Get number of stations
npts = len(ds)

# Extract variables
no = ds.index + 1  # +1 because Pandas' RangeIndex defaults start with 0
lat = ds.lat
lon = ds.lon
Helper function to add plot elements to the axes
def create_axes(maintitle):
    # Generate figure (set its size (width, height) in inches)
    fig = plt.figure(figsize=(12, 6.5))

    # Generate axes
    ax = plt.axes(projection=ccrs.Mercator())

    # Set extent to show particular area of the map
    ax.set_extent([25.5, 45.2, 35.5, 42.5], ccrs.PlateCarree())

    # Add state boundaries other lake features
    ax.add_feature(cfeature.LAND, facecolor='none', edgecolor='gray')

    # Draw gridlines
    gl = ax.gridlines(
        crs=ccrs.PlateCarree(),
        draw_labels=True,
        dms=False,
        x_inline=False,
        y_inline=False,
        linewidth=1,
        color="gray",
        alpha=0.25,
    )

    # Set frequency of gridlines in the x and y directions
    gl.xlocator = mticker.FixedLocator(np.arange(26, 45, 2))
    gl.ylocator = mticker.FixedLocator(np.arange(36, 43, 1))

    # Turn top/right labels
    gl.top_labels = False
    gl.right_labels = False

    # Set label sizes
    gl.xlabel_style = {"rotation": 0, "size": 14}
    gl.ylabel_style = {"rotation": 0, "size": 14}

    # Manually turn off ticks on top and right spines
    ax.tick_params(axis='x', top=False)
    ax.tick_params(axis='y', right=False)

    # Add title
    ax.set_title(maintitle, fontweight='bold', fontsize=18, y=1.03)

    return fig, ax
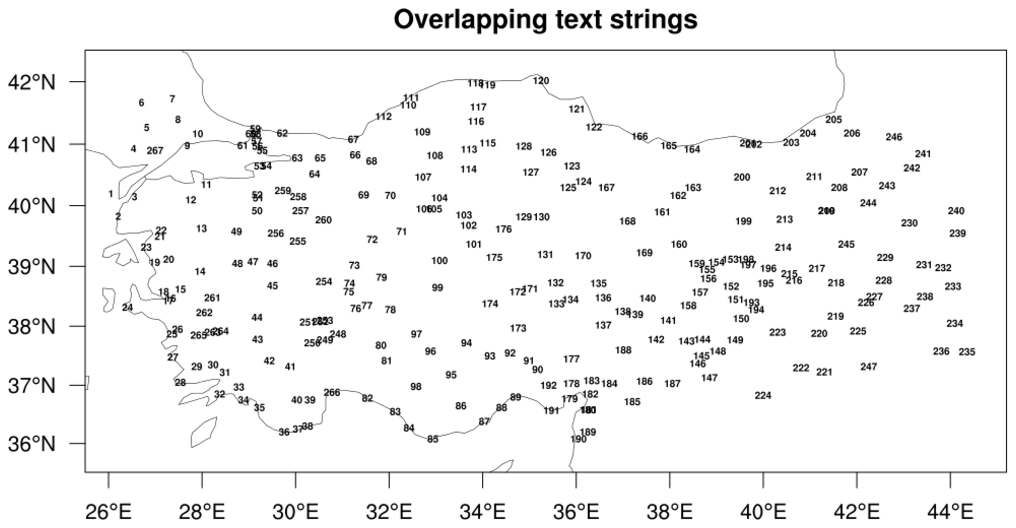
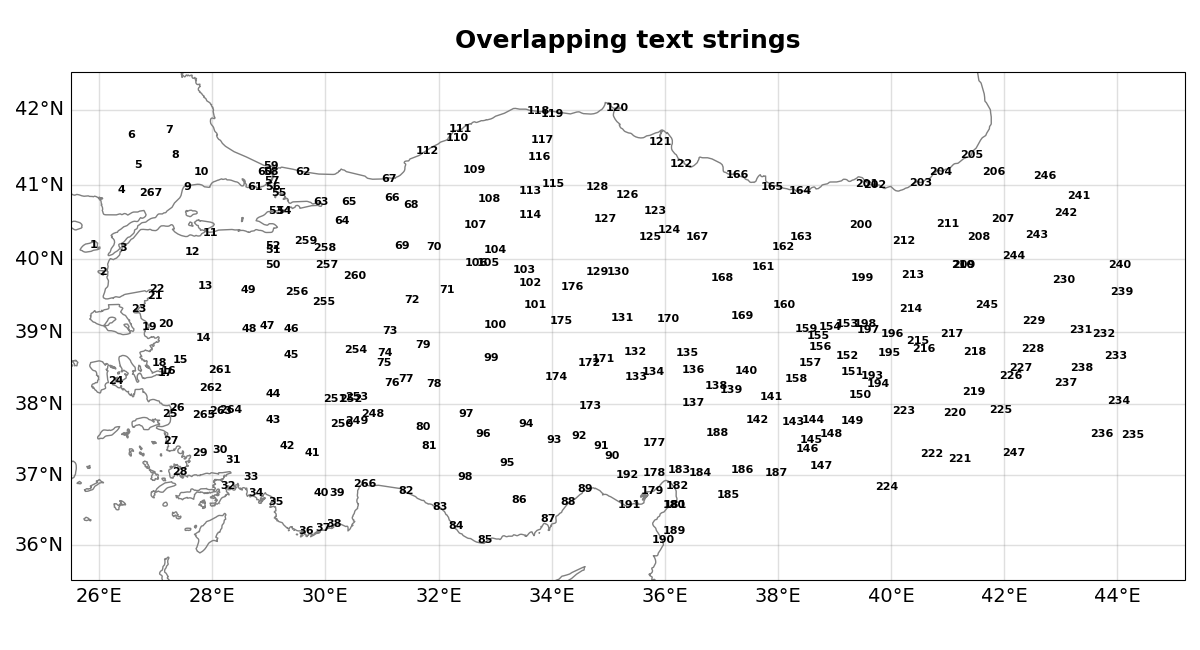
Plot with texts overlapping
fig, ax = create_axes('Overlapping text strings')

# Add all station number texts
for i in range(npts):
    ax.text(
        lon[i],
        lat[i],
        no[i],
        fontsize=8,
        fontweight='bold',
        va='center',
        ha='center',
        transform=ccrs.PlateCarree(),
    )

# Show the plot
plt.tight_layout()
plt.show()
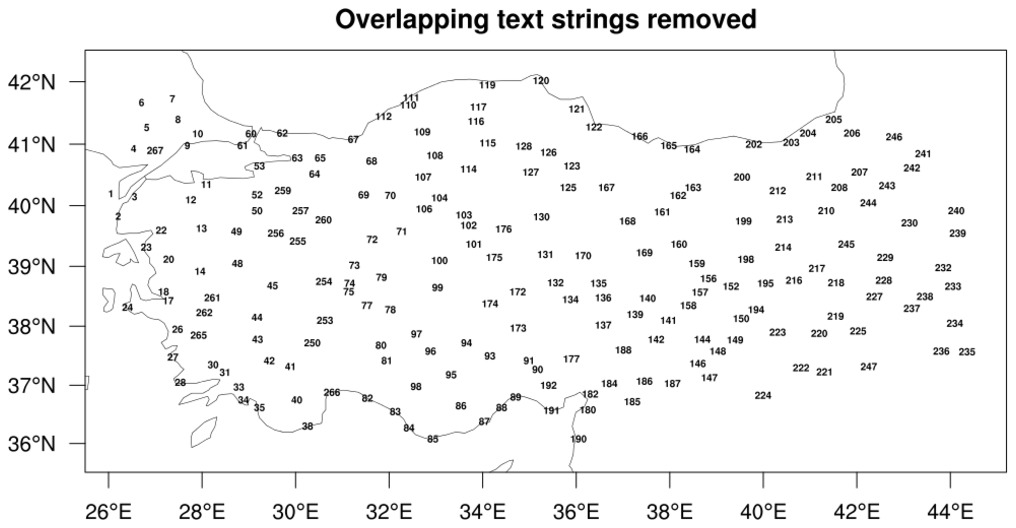
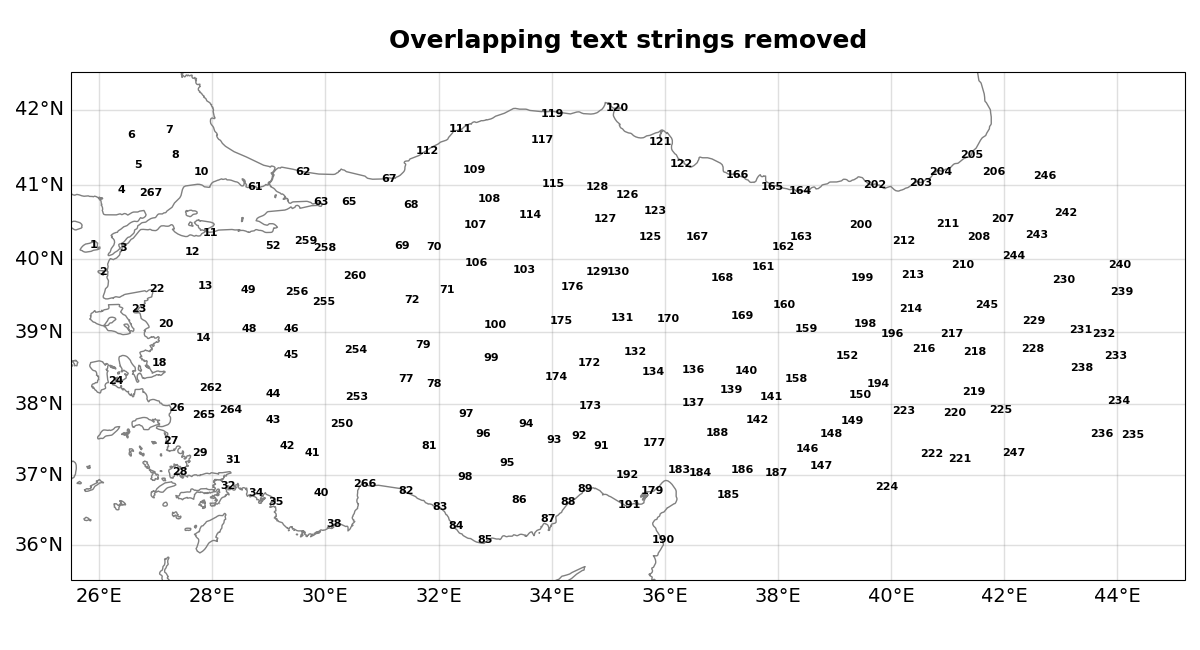
Plot without texts overlapping
fig, ax = create_axes('Overlapping text strings removed')

# Transpose the array of longitude and latitude for easier access of the location of each station point
location = np.transpose(np.array([lon, lat]))

# Create an array of booleans denoting if station would be removed
remove = np.full(npts, False)

# Currently minimum distance is calculated through finding distance between two suitable stations
# In the future we would like to find mindist by finding the width and height of texts in pixel coordinates
mindist = np.sqrt(np.sum(np.square(location[123] - location[124])))

# Tag station to be removed using array `remove`
# Loop through every pair of stations and calculate distances between them
for i in range(npts):
    for j in range(npts):
        # Calculate euclidean distance with numpy functions
        dist = np.sqrt(np.sum(np.square(location[j] - location[i])))
        if dist <= mindist and i != j and not remove[j]:
            # Tag one of the stations to be removed if distance between them allows for overlap,
            # they are different stations, and if the other station will not be removed
            remove[i] = True

# Add text if it is not tagged to be removed
for i in range(npts):
    if not remove[i]:
        ax.text(
            lon[i],
            lat[i],
            no[i],
            fontsize=8,
            fontweight='bold',
            va='center',
            ha='center',
            transform=ccrs.PlateCarree(),
        )

# Show the plot
plt.tight_layout()
plt.show()
Total running time of the script: (0 minutes 16.675 seconds)