

Note
Go to the end to download the full example code.
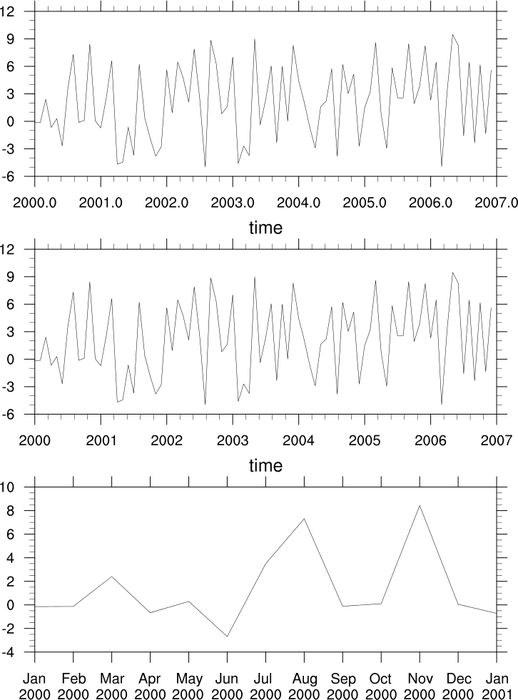
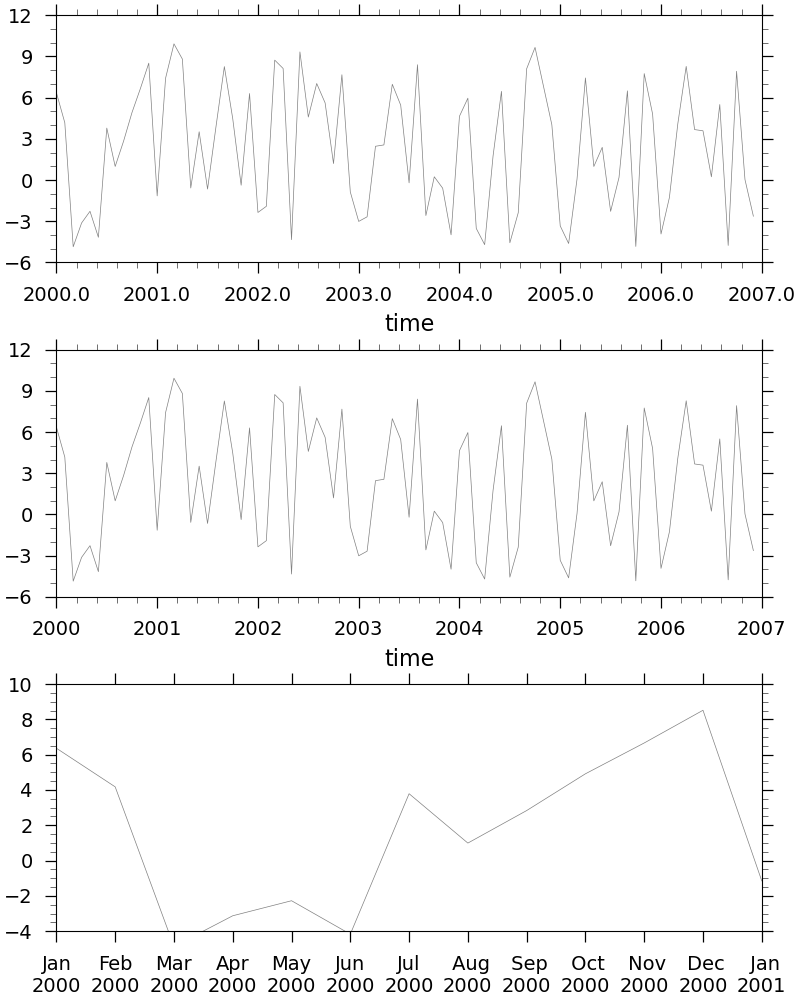
NCL_time_labels_1.py#
- This script illustrates the following concepts:
Labeling the X axis with nicely-formatted time labels
Setting the precision of tickmark labels
Generating dummy data using numpy’s random.uniform
Removing trailing zeros from tickmark labels
Setting the minimum/maximum value of the X axis in an XY plot
Changing the width and height of a plot
- See following URLs to see the reproduced NCL plot & script:
Original NCL script: https://www.ncl.ucar.edu/Applications/Scripts/time_labels_1.ncl
Original NCL plot: https://www.ncl.ucar.edu/Applications/Images/time_labels_1_lg.png
Import packages:
import numpy as np
import matplotlib.pyplot as plt
from matplotlib.ticker import FormatStrFormatter

import geocat.viz as gv
Generate date data:
tstart = 2000
tend = 2006
t_size = (tend - tstart + 1) * 12

# Create an array of years from tstart to tend in fractional format
# This has the same effect as NCL functions yyyymm_time() and yyyymm_to_yyyyfrac()
date = np.empty(t_size)
i = 0
for year in range(tstart, tend + 1):
    for mo in range(1, 13):  # Loop through all the months
        date[i] = year + (mo - 1) / 12
        i += 1

# Create random 1D array
arr = np.random.uniform(-5.0, 10.0, t_size)
Plot:
# Make three subplots
fig, ax = plt.subplots(3, 1, figsize=(8, 10), constrained_layout=True)

# Plot data
ax[0].plot(date, arr, color='gray', linewidth=0.5)
ax[1].plot(date, arr, color='gray', linewidth=0.5)
ax[2].plot(date[0:13], arr[0:13], color='gray', linewidth=0.5)

# format ytick labels
ax[0].xaxis.set_major_formatter(FormatStrFormatter('%.1f'))

for axes in [ax[0], ax[1]]:
    # Use geocat.viz.util convenience function to add minor and major tick lines
    gv.add_major_minor_ticks(
        axes, x_minor_per_major=5, y_minor_per_major=3, labelsize=14
    )

    # Use geocat.viz.util convenience function to set axes parameters without calling several matplotlib functions
    # Set axes limits
    gv.set_axes_limits_and_ticks(
        axes, xlim=(tstart, tend + 1), ylim=(-6, 12), yticks=np.arange(-6, 13, 3)
    )

# Add minor and major tick lines for plot 3
gv.add_major_minor_ticks(ax[2], x_minor_per_major=1, y_minor_per_major=4, labelsize=14)

# Set axes limits, ticks and tick labels for plot 3
gv.set_axes_limits_and_ticks(
    ax[2],
    xlim=(date[0], date[12]),
    ylim=(-4, 10),
    xticks=date[0:13],
    xticklabels=[
        'Jan\n2000',
        "Feb\n2000",
        "Mar\n2000",
        "Apr\n2000",
        "May\n2000",
        "Jun\n2000",
        "Jul\n2000",
        " Aug\n2000",
        " Sep\n2000",
        " Oct\n2000",
        " Nov\n2000",
        " Dec\n2000",
        " Jan\n2001",
    ],
    yticks=np.arange(-4, 11, 2),
)

# Add main title for plot 2 and 3
ax[1].set_title('time', fontsize=16, y=1.04)
ax[2].set_title('time', fontsize=16, y=1.04)

# Set spacing between tick labels and axes for all plots
[axes.tick_params('both', pad=9) for axes in ax.flat]

# Draw plot on the screen
plt.show()
Total running time of the script: (0 minutes 0.366 seconds)