

Note
Go to the end to download the full example code.
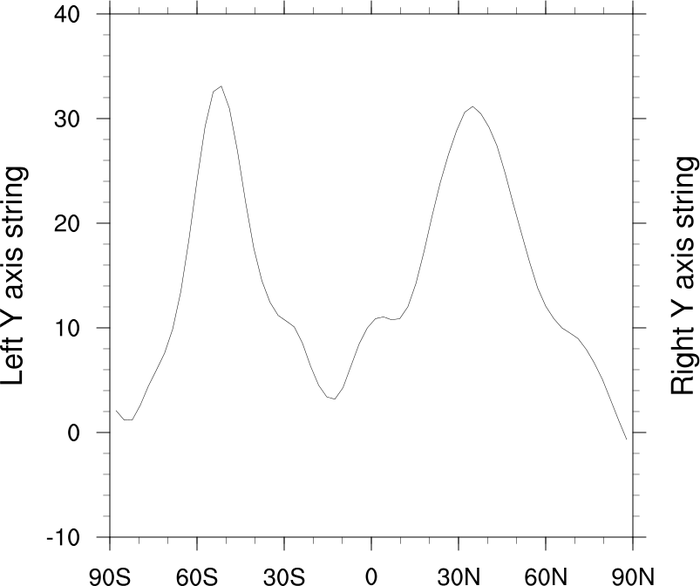
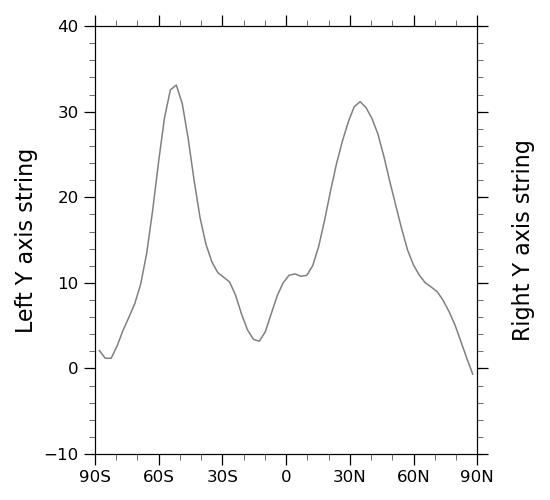
NCL_text_11.py#
- This script illustrates the following concepts:
Labeling both Y axes
Changing padding for axis labels
Setting line color and width
- See following URLs to see the reproduced NCL plot & script:
Original NCL script: https://www.ncl.ucar.edu/Applications/Scripts/text_11.ncl
Original NCL plot: https://www.ncl.ucar.edu/Applications/Images/text_11_lg.png
Import packages
import numpy as np
import xarray as xr
import matplotlib.pyplot as plt

import geocat.datafiles as gdf
import geocat.viz as gv
Read in data:
# Open a netCDF data file using xarray default engine and load data into xarray
data = xr.open_dataset(gdf.get("netcdf_files/uv300.nc"))

# Select data to be plotted
U = data.U[0, :, 0]
Plot:
# Generate figure (set its size (width, height) in inches) and axes
plt.figure(figsize=(5.5, 5))
ax = plt.gca()

# Create second y axis
ax1 = ax.twinx()

# Plot the specific slice of the data with the correct color and linewidth
U.plot(x="lat", color="gray", linewidth=1.1)

# Turn off automatic title
plt.title("")

# Use geocat.viz.util convenience function to add minor and major tick lines
gv.add_major_minor_ticks(ax, x_minor_per_major=3, y_minor_per_major=5, labelsize=12)

# Use geocat.viz.util convenience function to set axes parameters without calling several matplotlib functions
# Set axes limits, tick values, and tick labels to show latitude & longitude (i.e. North (N) - South (S))
gv.set_axes_limits_and_ticks(
    ax,
    xlim=(-90, 90),
    ylim=(-10, 40),
    xticks=np.linspace(-90, 90, 7),
    xticklabels=['90S', '60S', '30S', '0', '30N', '60N', '90N'],
)
gv.set_axes_limits_and_ticks(ax1, ylim=(-10, 40), yticklabels=[])

# Use geocat.viz.util convenience function to set titles and labels
gv.set_titles_and_labels(ax, ylabel="Left Y axis string")

# Set label on second y axis
ax1.set_ylabel("Right Y axis string", labelpad=18, fontsize=16)

# Show the plot
plt.tight_layout()
plt.show()
Total running time of the script: (0 minutes 0.119 seconds)