

Note
Go to the end to download the full example code.
NCL_traj_1.py#
- This script illustrates the following concepts:
Plotting a simple trajectory plot
Plotting multiple trajectories in different colors
Plotting every nth time step in a trajectory
- See following URLs to see the reproduced NCL plot & script:
Original NCL script: https://www.ncl.ucar.edu/Applications/Scripts/traj_1.ncl
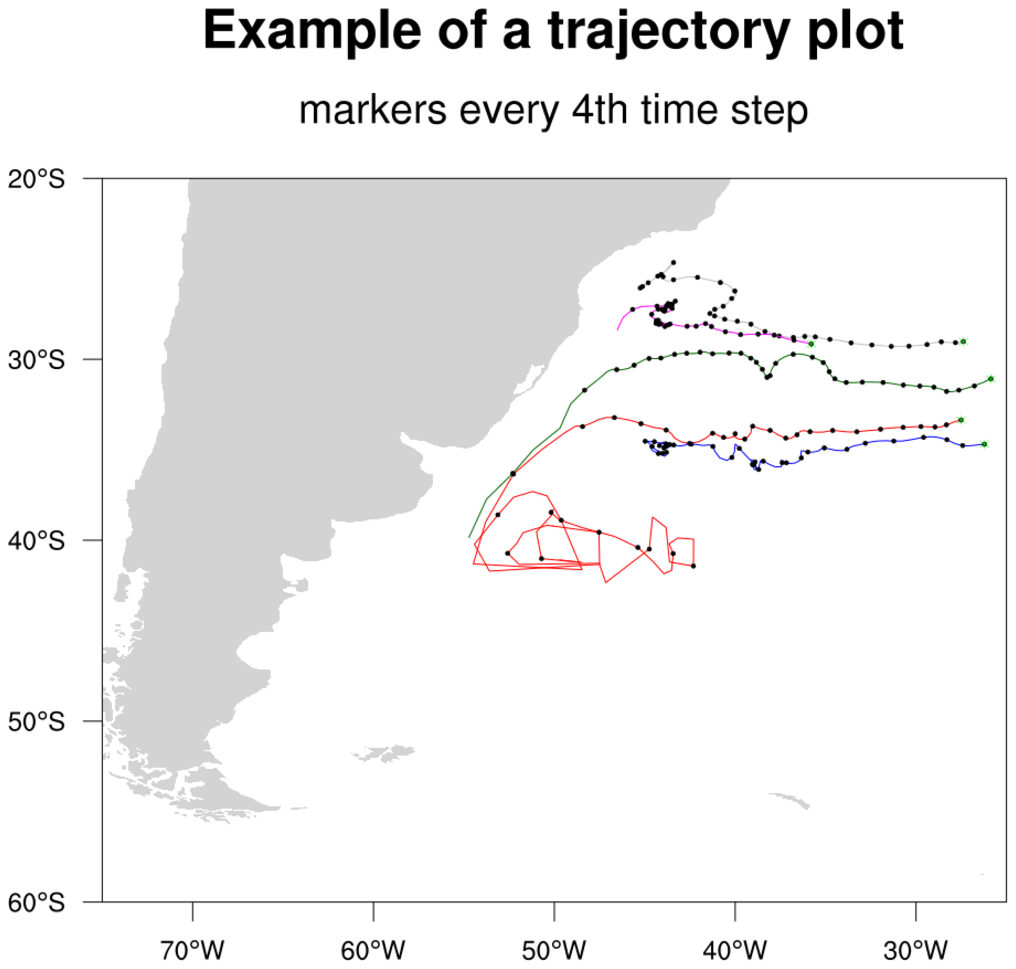
Original NCL plot: https://www.ncl.ucar.edu/Applications/Images/traj_1_lg.png
Import packages:
import xarray as xr
import geocat.datafiles as gdf
import cartopy.crs as ccrs
import cartopy.feature as cfeature
import matplotlib.pyplot as plt
import numpy as np

import geocat.viz as gv
Read in data:
# Open a netCDF data file using xarray default engine and load the data into xarrays
ds = xr.open_dataset(gdf.get('netcdf_files/traj_data.nc'))
sdata = ds.get('sdata')
Define helper function to plot every n-th timestep:
def plot_nth_timestep(nparrayy, nparrayx, n):
    for x in range(0, len(nparrayx)):
        # Plot green starting point of each trajectory
        if x == 0:
            y, x = nparrayy[x], nparrayx[x]
            plt.scatter(x, y, color='green', s=1, zorder=2.5)

        # Plot every n-th timestamp
        if x % n == 0:
            y, x = nparrayy[x], nparrayx[x]
            plt.scatter(x, y, color='black', s=1, zorder=2.5)
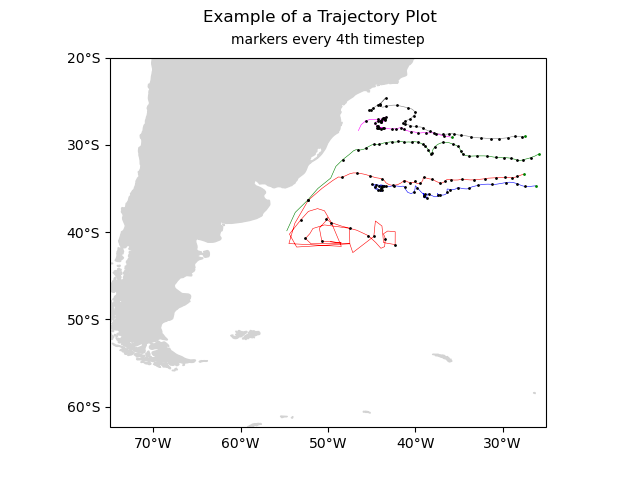
Plot:
# Initialize axes
ax = plt.axes(projection=ccrs.PlateCarree())
ax.set_extent([-75, -25, -60, -20], crs=None)

# Set title and subtitle
plt.suptitle('Example of a Trajectory Plot')
plt.title('markers every 4th timestep', fontsize=10, pad=10)

# Set land feature and change color to 'lightgrey'
# See link for extensive list of colors:
# https://matplotlib.org/3.1.0/gallery/color/named_colors.html
ax.add_feature(cfeature.LAND, color='lightgrey')

# Use geocat.viz.util convenience function to make plots look like NCL plots by using latitude, longitude tick labels
gv.add_lat_lon_ticklabels(ax)

# Use geocat.viz.util convenience function to set axes tick values
gv.set_axes_limits_and_ticks(
    ax, xticks=np.linspace(-70, -30, 5), yticks=np.linspace(-60, -20, 5)
)

# Select trajectories to plot
traj = [1, 10, 53, 67, 80]

# Set colors of each trajectory line
trajlinecolors = ["red", "blue", "green", "grey", "magenta"]

# Plot each trajectory
for i in range(len(traj)):
    # Extract latitude
    ypt = np.array(sdata[1, :, traj[i]]) - 360

    # Extract longitude
    xpt = np.array(sdata[2, :, traj[i]])

    plt.plot(ypt, xpt, color=trajlinecolors[i], linewidth=0.4)

    plot_nth_timestep(xpt, ypt, n=4)

plt.show()
Total running time of the script: (0 minutes 0.688 seconds)