

Note
Go to the end to download the full example code.
NCL_bar_7.py#
- This script illustrates the following concepts:
Drawing filled bars
Filling the bars in a bar plot with different colors
Setting the minimum/maximum value of the Y axis in a bar plot
Adding text to a plot
Rotating text 45 degrees
Drawing a custom legend
- See following URLs to see the reproduced NCL plot & script:
Original NCL script: https://www.ncl.ucar.edu/Applications/Scripts/bar_7.ncl
Original NCL plot: https://www.ncl.ucar.edu/Applications/Images/bar_7_1_lg.png and https://www.ncl.ucar.edu/Applications/Images/bar_7_2_lg.png
Import packages:
import numpy as np
import matplotlib.pyplot as plt

import geocat.viz as gv
Generate data:
x = [1, 2, 3, 4, 5, 6, 7, 8]
data = [154900, 56600, 40000, 30200, 29700, 24400, 21700, 13900]
labels = [
    'Lung',
    'Colon/rectum',
    'Breast',
    'Prostate',
    'Pancreas',
    'Non-Hodgkin\'s Lymphoma',
    'Leukemias',
    'Ovary',
]
Create the custom color list.
color_list = [
    'firebrick',
    'red',
    'orange',
    'green',
    'navy',
    'blue',
    'skyblue',
    'slateblue',
]
Specify some plot settings to use in both plots:
# Title settings
title = 'Estimated Cancer Deaths for 2002'
title_fontsize = 16

# Axis Settings
plot_y_max = 180_000
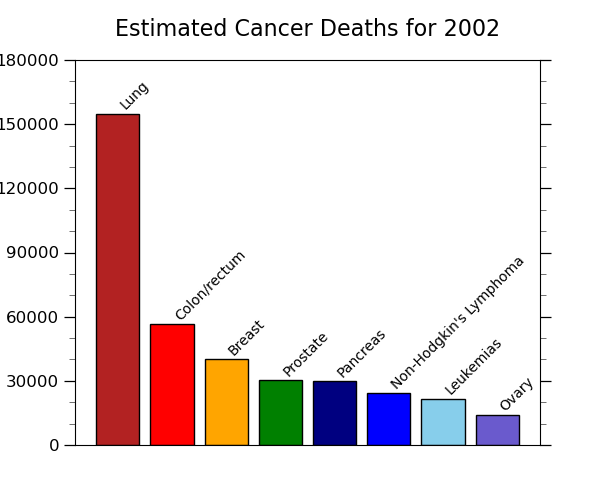
Plot 1 (Bar chart):
# Generate figure (set its size (width, height) in inches) and axes
plt.figure(1, figsize=(6, 5))
ax = plt.gca()

# Bar-plot the data
plt.bar(x, data, color=color_list, edgecolor='black')
plt.title(title, fontsize=title_fontsize, y=1.04)

# Add a rotated label to each bar.
for k, label in enumerate(labels):
    plt.text(x[k], data[k] + 2000, label, rotation=45)

# Use geocat.viz.util convenience function to set axes limits & tick values without calling several matplotlib functions
gv.set_axes_limits_and_ticks(
    ax, ylim=(0, plot_y_max), xticks=[], yticks=np.linspace(0, plot_y_max, 7)
)

# Use geocat.viz.util convenience function to add minor and major tick lines
gv.add_major_minor_ticks(ax, x_minor_per_major=0, y_minor_per_major=3, labelsize=12)

# Draw plot on the screen.
plt.show()
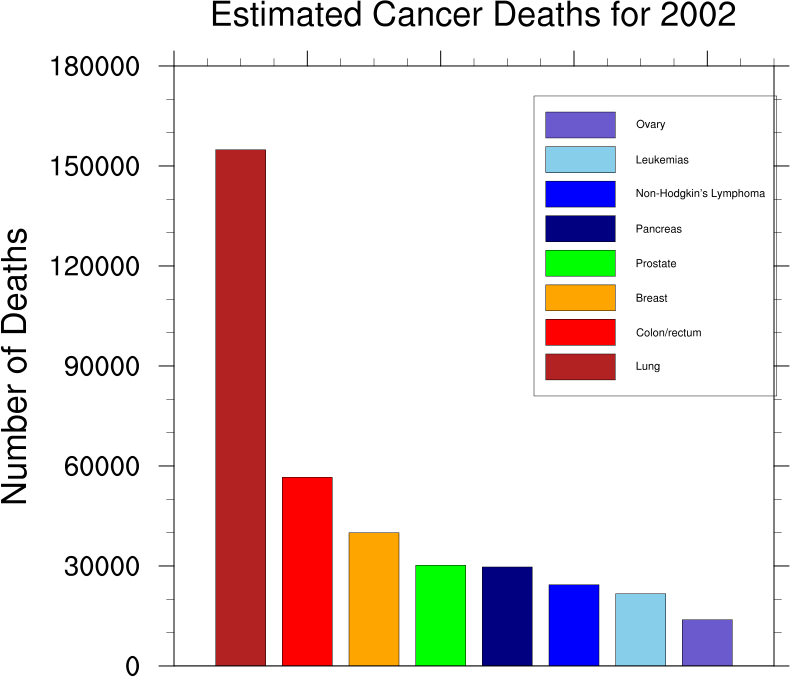
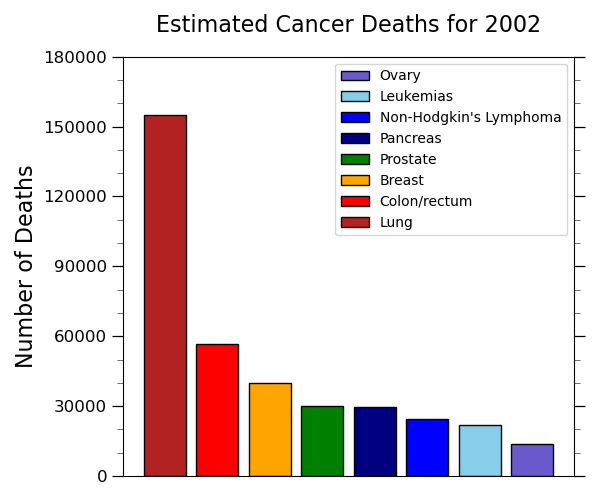
Plot 2 (Bar chart with a legend):
# Generate figure (set its size (width, height) in inches) and axes
plt.figure(2, figsize=(6, 5))
ax = plt.gca()

# Bar-plot the data
bar_handle = plt.bar(x, data, color=color_list, edgecolor='black')

# Reverse the legend ordering to match NCL
bars_reversed = bar_handle[::-1]
labels_reversed = labels[::-1]

# Add the legend
plt.legend(bars_reversed, labels_reversed)

# Use geocat.viz.util convenience function to set axes limits & tick values without calling several matplotlib functions
gv.set_axes_limits_and_ticks(
    ax, ylim=(0, plot_y_max), xticks=[], yticks=np.linspace(0, plot_y_max, 7)
)

# Use geocat.viz.util convenience function to add minor and major tick lines
gv.add_major_minor_ticks(ax, x_minor_per_major=0, y_minor_per_major=3, labelsize=12)

# Use geocat.viz.util convenience function to set titles and labels without calling several matplotlib functions
gv.set_titles_and_labels(
    ax, maintitle=title, maintitlefontsize=title_fontsize, ylabel="Number of Deaths"
)

# Show the plot
plt.tight_layout()
plt.show()
Total running time of the script: (0 minutes 0.180 seconds)