

Note
Go to the end to download the full example code.
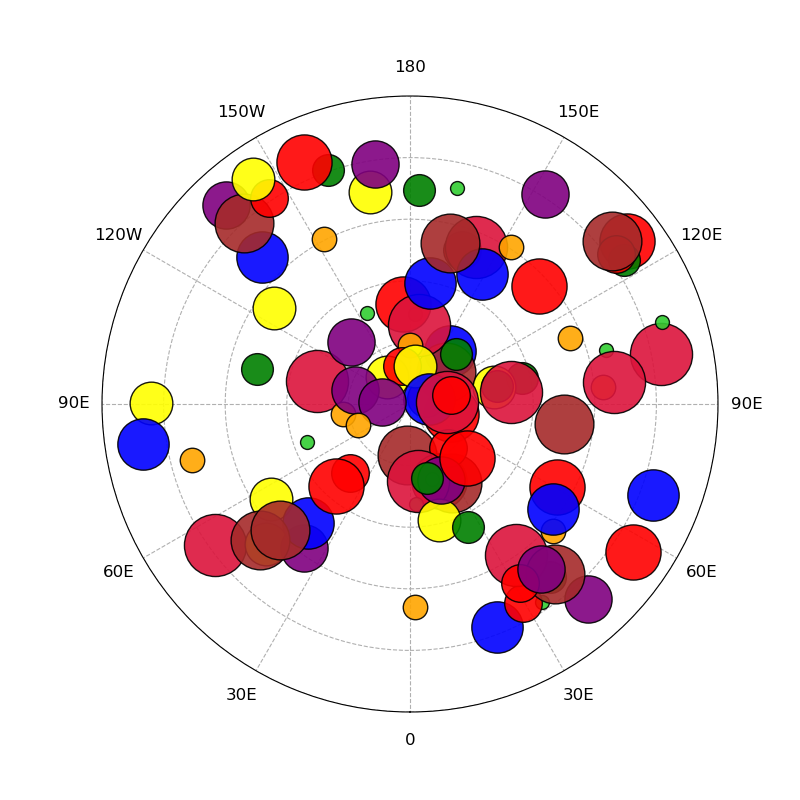
NCL_scatter_6.py#
- This script illustrates the following concepts:
Drawing a scatter plot with markers of different colors and sizes
Drawing outlined and filled markers on a polar map plot
Generating dummy data using “random”
Changing the marker colors on a polar map plot
Changing the marker sizes on a polar map plot
Turning off y-axis labels
- See following URLs to see the reproduced NCL plot & script:
Original NCL script: https://www.ncl.ucar.edu/Applications/Scripts/scatter_6.ncl
Original NCL plot: https://www.ncl.ucar.edu/Applications/Images/scatter_6_lg.png
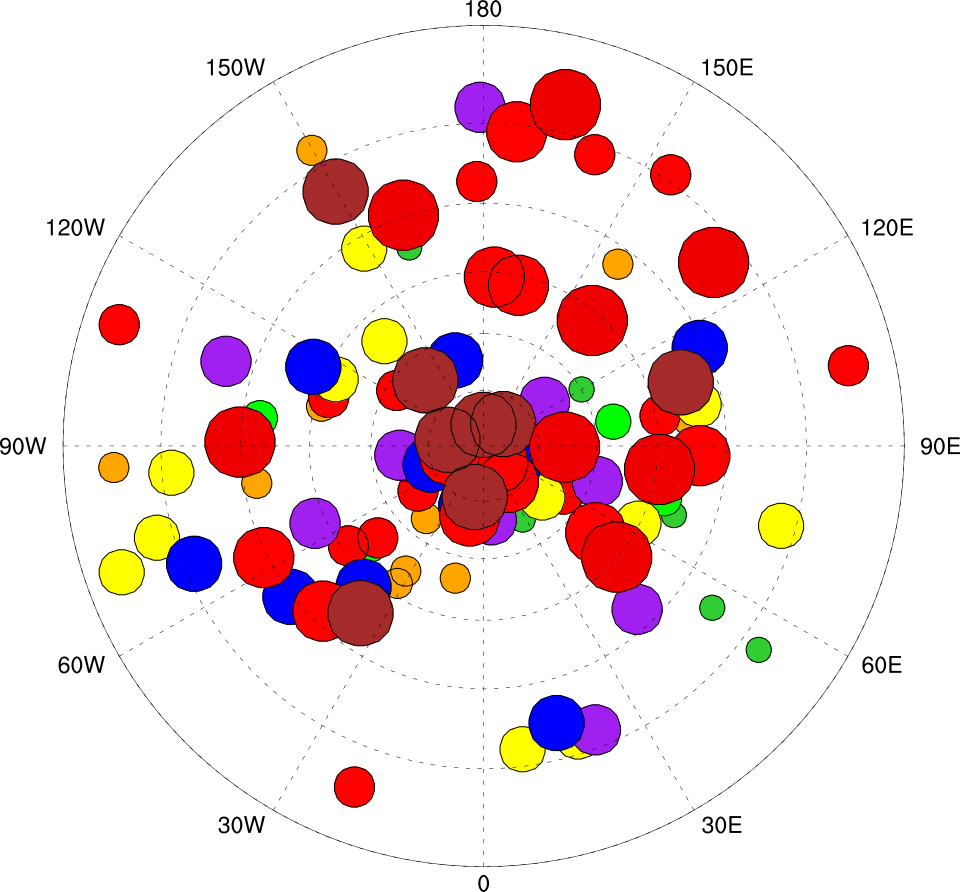
Import packages:
import numpy as np
import matplotlib.pyplot as plt
Create dummy data:
numpoints = 100
lon = np.random.uniform(0, 360, numpoints)
lat = np.random.uniform(5, 90, numpoints)
# Generate a figure
fig = plt.figure(figsize=(8, 8))

# Create axis with a polar projection
ax = fig.add_subplot(111, projection='polar')
ax.set_ylim([0, 90])

# Change orientation of projection
ax.set_theta_zero_location("S")

# Create array of marker colors
colors = (
    "limegreen",
    "orange",
    "green",
    "red",
    "yellow",
    "purple",
    "blue",
    "red",
    "brown",
    "crimson",
    "skyblue",
)

# Create array of marker sizes
bins = np.linspace(100, 2000, 10)

# Plot all points
# longitude points must be transformed from degrees to radians
# to be plotted on polar projection
for x in range(numpoints):
    ax.scatter(
        (np.pi / 180.0) * lon[x],
        lat[x],
        color=colors[x % 10],
        s=bins[x % 10],
        edgecolors='black',
        linewidths=1,
        alpha=0.9,
        zorder=2,
    )

# set the labels and locations of the angular gridlines
linelabels = (
    '0',
    '30E',
    '60E',
    '90E',
    '120E',
    '150E',
    '180',
    '150W',
    '120W',
    '90E',
    '60E',
    '30E',
)
lines, labels = plt.thetagrids(range(0, 360, 30), linelabels, fontsize=12)

# Create distance between the x tick labels and the axis
ax.tick_params(axis='x', pad=10)

# Set y-axis gridlines and turn off y-axis labels
ax.set_yticks([0, 20, 40, 60, 80, 100])
ax.set_yticklabels([])

# Make gridlines dashed
ax.grid(linestyle='--')

plt.show()
Total running time of the script: (0 minutes 0.257 seconds)