

Note
Go to the end to download the full example code.
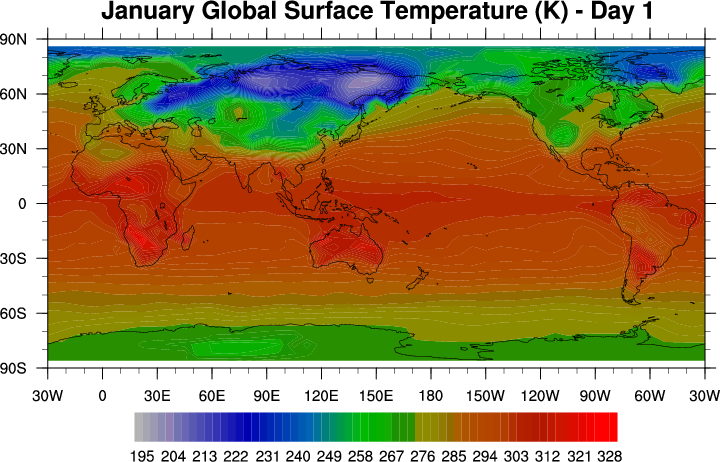
NCL_animate_1.py#
- This script illustrates the following concepts:
Creating animations using matplotlib.FuncAnimation
- See following URLs to see the reproduced NCL plot & script:
Original NCL script: https://www.ncl.ucar.edu/Applications/Scripts/animate_1.ncl
Original NCL plot: https://www.ncl.ucar.edu/Applications/Images/animate_1_1_lg.png
- Please note:
Executing this script will not display a gif, but you have the option to uncomment a line at the bottom that will save a gif in the same directory as this script.
Import packages:
import cartopy.crs as ccrs
import matplotlib.animation as animation
import numpy as np
import xarray as xr
from matplotlib import pyplot as plt
import geocat.datafiles as gdf
import geocat.viz as gv
Read in data:
# Open a netCDF data file using xarray default engine and load the data into xarrays
# Disable time decoding due to missing necessary metadata
ds = xr.open_dataset(gdf.get("netcdf_files/meccatemp.cdf"), decode_times=False)
tas = ds.t
Create animation:
fig = plt.figure(figsize=(10, 8))
# Generate axes using Cartopy and draw coastlines
ax = plt.axes(projection=ccrs.PlateCarree(central_longitude=150))
ax.coastlines(linewidths=0.5)
ax.set_extent([-180, 180, -90, 90], ccrs.PlateCarree())
# Use geocat-viz convenience function to set axes limits & tick values
gv.set_axes_limits_and_ticks(
ax,
xlim=(-180, 180),
ylim=(-90, 90),
xticks=np.linspace(-180, 180, 13),
yticks=np.linspace(-90, 90, 7),
)
# Use geocat-viz convenience function to add minor and major tick lines
gv.add_major_minor_ticks(ax, labelsize=10)
# Use geocat-viz convenience function to make latitude, longitude tick labels
gv.add_lat_lon_ticklabels(ax)
# Create initial plot
cplot = tas[0, :, :].plot.contourf(
ax=ax,
transform=ccrs.PlateCarree(),
vmin=195,
vmax=328,
levels=53,
cmap="inferno",
add_colorbar=False,
)
# Create a colorbar
cbar = fig.colorbar(
cplot,
extendrect=True,
orientation="horizontal",
ticks=np.arange(195, 332, 9),
label="",
shrink=0.90,
)
# Remove minor ticks from colorbar that don't work well with other formatting
cbar.ax.minorticks_off()
# Animate function for matplotlib FuncAnimation
def animate(i):
tas[i, :, :].plot.contourf(
ax=ax,
transform=ccrs.PlateCarree(),
vmin=195,
vmax=328,
levels=53,
cmap="inferno",
add_colorbar=False,
)
gv.set_titles_and_labels(
ax,
maintitle="January Global Surface Temperature (K) - Day "
+ str(tas.coords['time'].values[i])[:13],
xlabel="",
ylabel="",
)
# Run the animation initiated with the frame from init and progressed with the animate function
anim = animation.FuncAnimation(fig, animate, frames=30, interval=200)
# Uncomment this line to save the animation
# anim.save('animate_1.gif', writer='pillow', fps=5)
Total running time of the script: (1 minutes 2.669 seconds)