

Note
Go to the end to download the full example code.
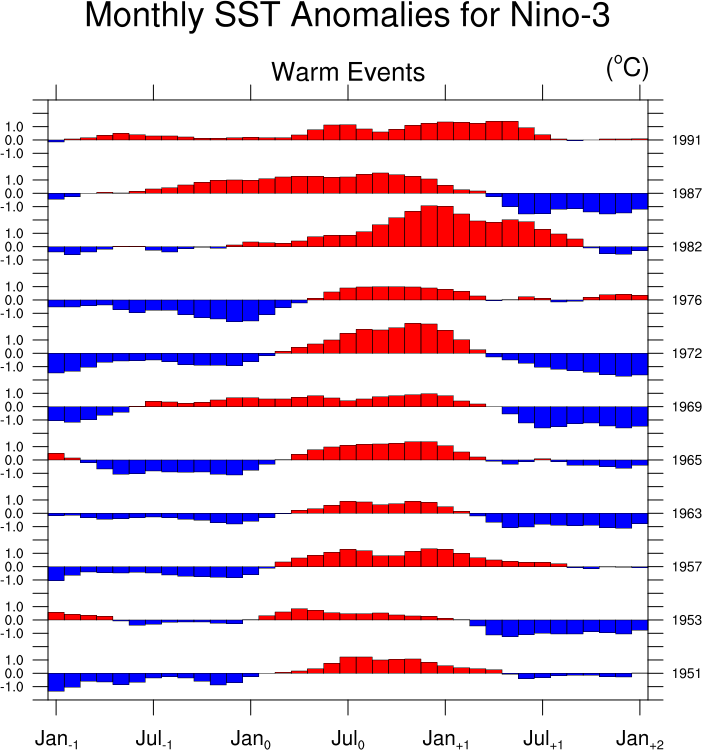
NCL_bar_5.py#
- This script illustrates the following concepts:
Drawing multiple sets of filled bar charts up or down based on Y reference values
Drawing bar charts
Changing the labels and tickmarks in a bar plot
Adding labels to the right Y axis
- See following URLs to see the reproduced NCL plot & script:
Original NCL script: https://www.ncl.ucar.edu/Applications/Scripts/bar_5.ncl
Original NCL plots: https://www.ncl.ucar.edu/Applications/Images/bar_5_lg.png
Import packages
import numpy as np
import xarray as xr
import matplotlib.pyplot as plt

import geocat.datafiles as gdf
import geocat.viz as gv
Read in data:
# Open a netCDF data file using xarray default engine and load the data
ds = xr.open_dataset(gdf.get("netcdf_files/Jsst.nc"))
sst = ds.SST
date = ds.date

# scale the sst variable to range from around -1 to 1
sst = sst * 0.1

# Dates in the file are represented by year and month (YYYYMM)
# representing them fractionally will make plotting the data easier
# This produces the same results as NCL's yyyymm_to_yyyyfrac() function
num_months = np.shape(date)[0]
date_frac = np.empty_like(date)
for n in np.arange(0, num_months, 1):
    yyyy = int(date[n] / 100)
    mon = (date[n] / 100 - yyyy) * 100
    date_frac[n] = yyyy + (mon - 1) / 12
Plot:
# Create two lists of values: one for years represented and another for Y values
# in inches of the bottom left corner of year graph
warm = [1951, 1953, 1957, 1963, 1965, 1969, 1972, 1976, 1982, 1987, 1991]
heights_list = [
    0.0585,
    0.128,
    0.195,
    0.267,
    0.342,
    0.4,
    0.482,
    0.541,
    0.636,
    0.686,
    0.763,
]

# Set the number of subplots
num_subplots = 11
fig_height = num_subplots

# Create figure and default axis which will be visible
fig, ax0 = plt.subplots(figsize=(8, fig_height + 2), constrained_layout=True)

# Loop through heights in heights_list and create a different axis in ax_dict
# at each y height
i = 1
ax_dict = {}
for height in heights_list:
    ax_dict["ax" + str(i)] = fig.add_axes([0.003, height, 0.984, 0.0658])
    i = i + 1

# Loop through the axes created in ax_dict and years in warm to make a bar plot for each set
for ax, year in zip(ax_dict, warm):
    # Find year limits of each bar chart
    year_start = year - 1
    year_end = year + 3

    # Find the indices for each of the year limits
    year_istart = int((np.where(np.round(date_frac, 3) == year_start)[0]).item())
    year_iend = int((np.where(np.round(date_frac, 3) == year_end)[0]).item())

    # Create each bar chart where it is red if it is above 0 and blue if below
    ax_dict[ax].bar(
        date_frac[year_istart:year_iend],
        sst[year_istart:year_iend],
        align='edge',
        edgecolor='black',
        color=[
            'red' if (value > 0) else 'blue' for value in sst[year_istart:year_iend]
        ],
        width=0.08,
        linewidth=1,
    )
    # Turn off axis so it is not visible
    ax_dict[ax].axis("off")

# Create right y axis by cloning the left side
axRHS = ax0.twinx()

# Make a variable for the degree symbol
degree = "\u00b0"

# Use geocat.viz.util convenience function to add titles to the center and right of the plot axis
gv.set_titles_and_labels(
    ax0,
    maintitle="Monthly SST Anomalies for Nino-3",
    maintitlefontsize=25,
    righttitle=("(" + degree + "C)"),
    righttitlefontsize=18,
)
# Add center title
ax0.text(0.38, 1.05, 'Warm Events', fontsize=18, transform=ax0.transAxes)

# Use geocat.viz.util convenience function to add major tick lines
gv.add_major_minor_ticks(ax0, x_minor_per_major=1, y_minor_per_major=1)

# Create the tick labels for the left axis
left_y_ticks = []
i = 0
left_y_ticks.append("")
while i < num_subplots:
    left_y_ticks.append("-1.0")
    left_y_ticks.append("0.0")
    left_y_ticks.append("1.0")
    left_y_ticks.append("")
    i = i + 1
left_y_ticks.append("")

# Create the tick labels for the right axis
right_y_ticks = []
right_y_ticks.append("")
for year in warm:
    right_y_ticks.append("")
    right_y_ticks.append(year)
    right_y_ticks.append("")
    right_y_ticks.append("")
right_y_ticks.append("")

# Use geocat.viz.util convenience function to set axes limits & tick values without calling several matplotlib functions
gv.set_axes_limits_and_ticks(
    ax0,
    xlim=(-3, 3),
    xticks=np.linspace(-3, 3, 7),
    xticklabels=["Jan₋₁", "Jul₋₁", "Jan₀", "Jul₀", "Jan₊₁", "Jul₊₁", "Jan₊₂"],
    yticks=np.linspace(0, 46, 46),
    yticklabels=left_y_ticks,
)

ax0.spines['right'].set_visible(False)
gv.set_axes_limits_and_ticks(
    axRHS, ylim=(0, 45), yticks=np.linspace(0, 45, 46), yticklabels=right_y_ticks
)

# Set tick parameters for all axes
ax0.tick_params(axis="x", length=9, labelsize=12)
ax0.tick_params(axis="y", length=5, labelsize=8)
axRHS.tick_params(axis="y", length=6, labelsize=8)

# Show plot
plt.plot()
[]
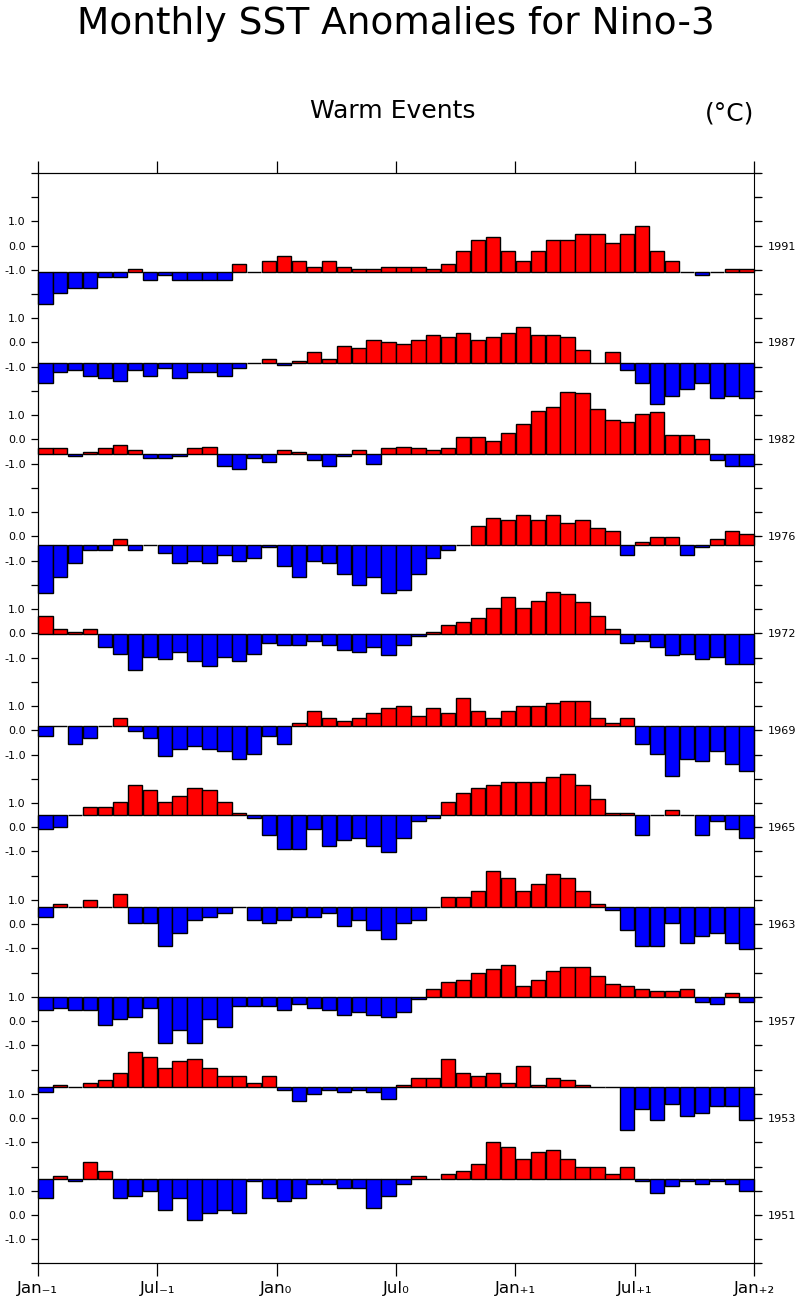
Although the code above does recreate the NCL plot, it is tedious to replicate it in Python. A different process to use is subplots, which, in the specific example below, each have their own axes. This not only makes the graph easier to read, but is much simpler to recreate. The subplot method is shown below.
Plot utilizing the subplot method:
# Create the figure with figure size (width, height) in inches
fig2, ax2 = plt.subplots(11, 1, figsize=(6, 8))

# Loop through all of the years and plot them as a bar chart
i = 0
for year in warm:
    # Find year limits of each bar chart
    year_start = year - 1
    year_end = year + 3

    # Find the indices for each of the year limits
    year_istart = int((np.where(np.round(date_frac, 3) == year_start)[0]).item())
    year_iend = int((np.where(np.round(date_frac, 3) == year_end)[0]).item())

    # Create each bar chart where it is red if it is above 0 and blue if below
    ax2[i].bar(
        date_frac[year_istart:year_iend],
        sst[year_istart:year_iend],
        align='edge',
        edgecolor='black',
        color=[
            'red' if (value > 0) else 'blue' for value in sst[year_istart:year_iend]
        ],
        width=0.08,
        linewidth=1,
    )

    # Set ticks and limits for axes using convenience function
    gv.set_axes_limits_and_ticks(
        ax2[i],
        xlim=((year_start), year_end),
        xticks=np.linspace(year_start, year_end, 5),
        ylim=(-3, 3.5),
        yticks=np.linspace(-2, 2, 3),
    )

    # Use geocat.viz.util convenience function to add major tick lines
    gv.add_major_minor_ticks(ax2[i], x_minor_per_major=4, y_minor_per_major=2)

    # Create right hand side axis, add the year as a title to the axis, and remove labels
    ax2RHS = ax2[i].twinx()
    ax2RHS.set_ylabel(str(year), size=8, fontweight='bold')
    ax2RHS.set_yticklabels([])

    # Set the tick and tick label size for both axes on all subplots
    ax2[i].tick_params(axis="x", size=5, labelsize=5)
    ax2[i].tick_params(axis="y", size=7, labelsize=6)

    i = i + 1

# Adjust the white space between each subplot
plt.subplots_adjust(hspace=1)

# Make a variable for the degree symbol
degree = "\u00b0"

# Add title to entire figure
fig2.suptitle(
    "Monthly SST Anomalies for Nino-3",
    horizontalalignment='center',
    y=0.93,
    fontsize=15,
    fontweight='bold',
)

# Add subtitles
fig2.text(0.42, 0.895, 'Warm Events', fontsize=9)
fig2.text(0.12, 0.895, "(" + degree + "C)", fontsize=9)

plt.show()
Total running time of the script: (0 minutes 2.139 seconds)