

Note
Go to the end to download the full example code.
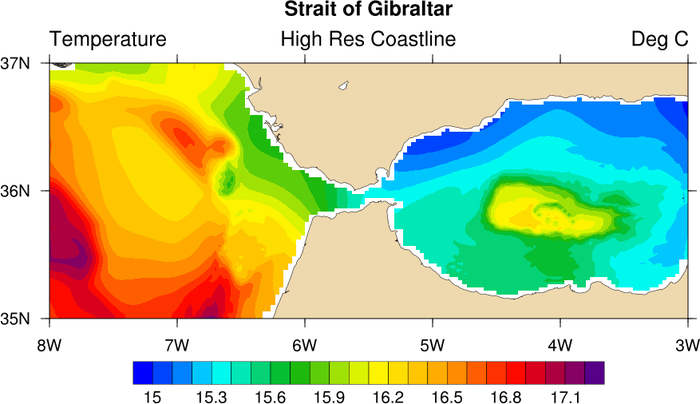
NCL_coast_1.py#
- This script illustrates the following concepts:
Drawing color-filled contours over a cylindrical equidistant map
Specifying and drawing three different resolutions for map outlines
Zooming in on a particular area on the map
Moving title and colorbar locations
Following best practices when choosing a colormap. More information on colormap best practices can be found here.
- See following URLs to see the reproduced NCL plot & script:
Import packages
import numpy as np
import xarray as xr
import cartopy.crs as ccrs
import cartopy.feature as cfeature
from cartopy.mpl.gridliner import LongitudeFormatter, LatitudeFormatter
import matplotlib.pyplot as plt

import geocat.datafiles as gdf
import geocat.viz as gv
Read in data:
# Open the netCDF data file using xarray
ds = xr.open_dataset(gdf.get("netcdf_files/tpom000.partial.nc"))

# Extract a slice of the data
t = ds.t
Plot:
def Plot(res, title):
fig = plt.figure(figsize=(8, 6))
# Generate axes, using Cartopy, drawing coastlines, and adding features
fig.tight_layout(pad=3)
projection = ccrs.PlateCarree()
ax1 = plt.axes(projection=projection)
ax1.coastlines(resolution=res, linewidths=0.5)
ax1.add_feature(cfeature.LAND.with_scale(res), facecolor="wheat")
# Contourf-plot data
temp = t.plot.contourf(
ax=ax1,
transform=projection,
levels=25,
vmin=14.9,
vmax=17.3,
cmap='magma',
add_colorbar=False,
)
# Add color bar
cbar_ticks = np.arange(15, 17.3, 0.3)
cbar = plt.colorbar(
temp,
orientation='horizontal',
shrink=0.8,
pad=0.073,
extendrect=True,
ticks=cbar_ticks,
)
cbar.ax.tick_params(labelsize=10)
# Use geocat.viz.util convenience function to set axes limit and tick values
gv.set_axes_limits_and_ticks(
ax1,
xlim=(-8, -3),
ylim=(35, 37),
xticks=np.linspace(-3, -8, 6),
yticks=np.linspace(35, 37, 3),
)
# Use geocat.viz.util convenience function to add major tick lines
gv.add_major_minor_ticks(ax1, y_minor_per_major=1, labelsize=12)
# Use geocat.viz.util convenience function to add lat and lon tick labels
gv.add_lat_lon_ticklabels(ax1)
# Remove degree symbol from tick label
ax1.yaxis.set_major_formatter(LatitudeFormatter(degree_symbol=''))
ax1.xaxis.set_major_formatter(LongitudeFormatter(degree_symbol=''))
# Use geocat.viz.util convenience function to set titles and labels
gv.set_titles_and_labels(
ax1,
righttitle="Deg C",
righttitlefontsize=15,
lefttitle="Temperature",
lefttitlefontsize=15,
xlabel="",
ylabel="",
)
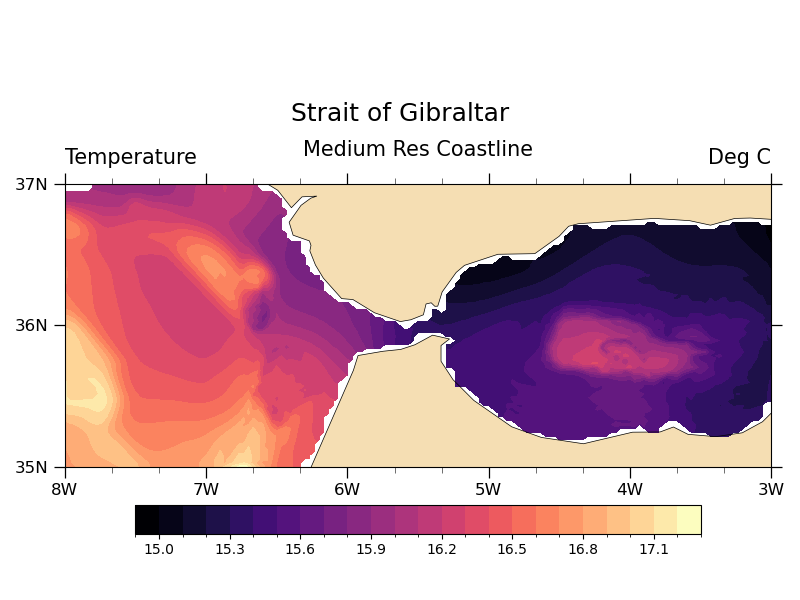
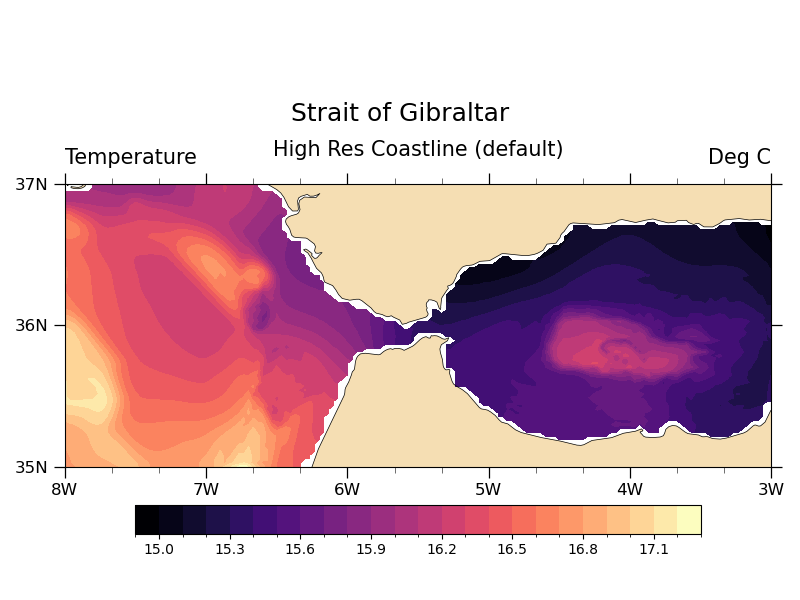
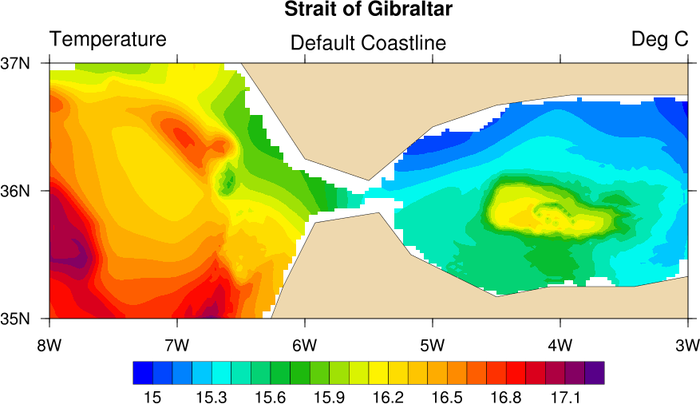
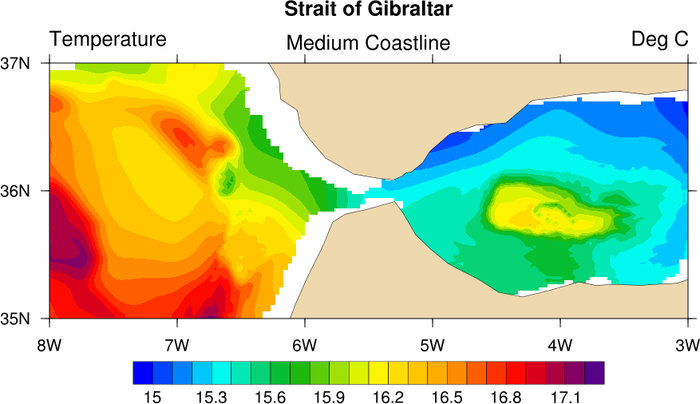
plt.suptitle("Strait of Gibraltar", x=0.5, y=0.83, fontsize=18)
plt.title(title, x=0.5, y=1.07, fontsize=15)
plt.tight_layout()
plt.show()
# Plot maps
Plot('110m', "Low Res Coastline")
Plot('50m', "Medium Res Coastline")
Plot('10m', "High Res Coastline (default)")

Total running time of the script: (0 minutes 3.298 seconds)