

Note
Go to the end to download the full example code.
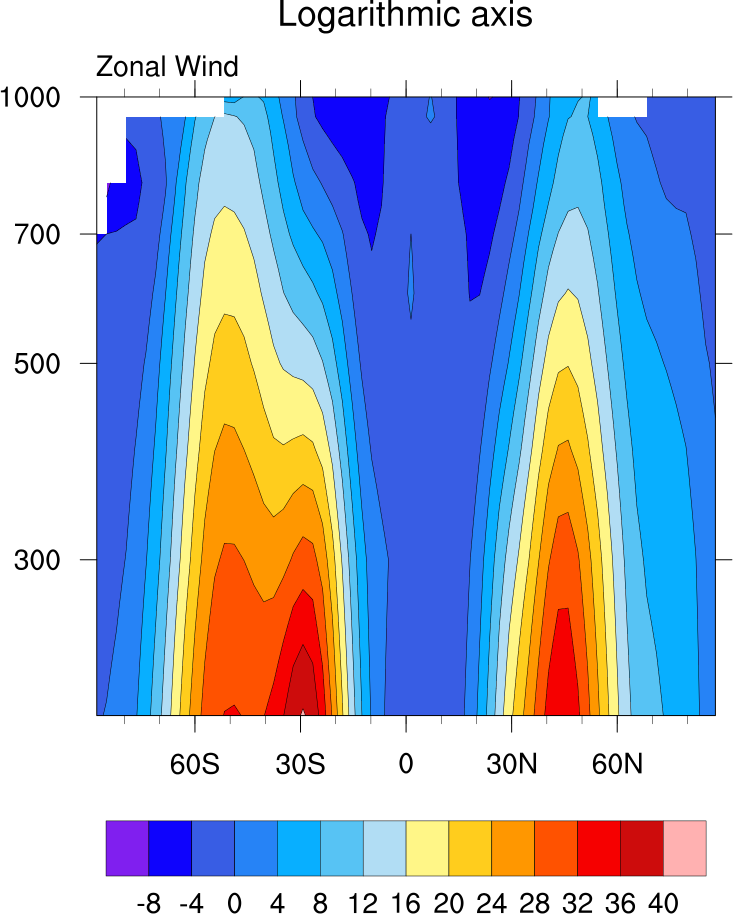
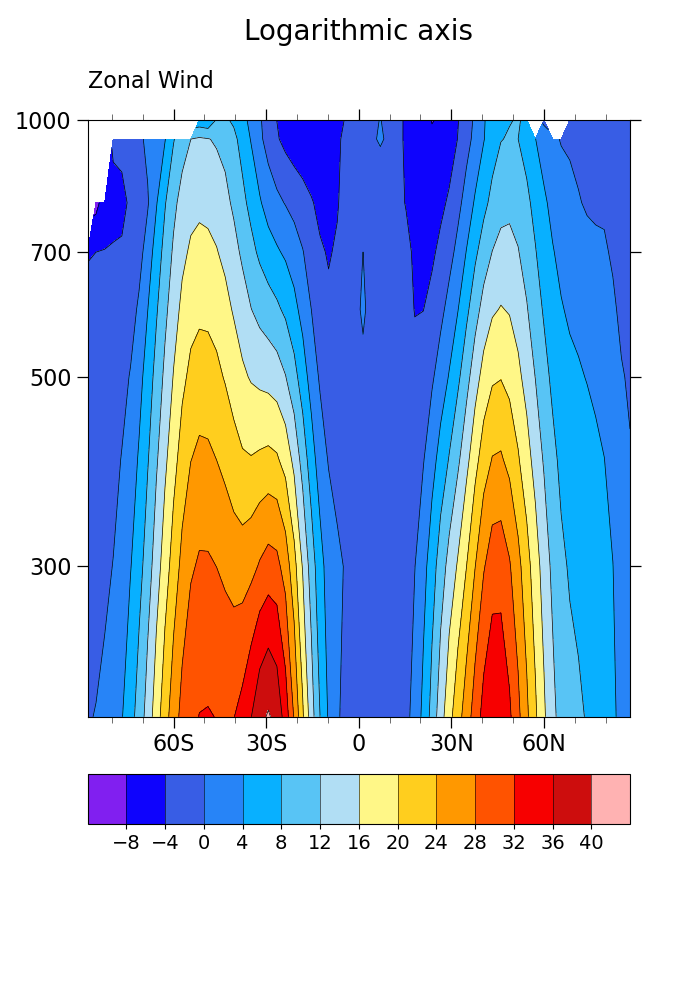
NCL_conwomap_5.py#
- This script illustrates the following concepts:
Drawing a simple contour plot
Making an axis logarithmic in a contour plot
Changing the labels and tickmarks on a contour plot
Creating a main title
Using the geocat-comp method interp_hybrid_to_pressure
- See following URLs to see the reproduced NCL plot & script:
Original NCL script: https://www.ncl.ucar.edu/Applications/Scripts/conwomap_5.ncl
Original NCL plot: https://www.ncl.ucar.edu/Applications/Images/conwomap_5_2_lg.png
Import packages:
import matplotlib.pyplot as plt
from matplotlib.ticker import ScalarFormatter
import numpy as np
import xarray as xr
import cmaps

from geocat.comp import interp_hybrid_to_pressure
import geocat.viz as gv
import geocat.datafiles as gdf
Read in data:
# Open a netCDF data file using xarray default engine and load the data into xarrays

ds = xr.open_dataset(gdf.get("netcdf_files/atmos.nc"), decode_times=False)

# Extract the data needed
u = ds.U[0, :, :, :]  # U component of wind
hyam = ds.hyam  # hybrid A coefficient
hybm = ds.hybm  # hybrid B coefficient
ps = ds.PS  # surface pressures in Pascals
p0 = 100000  # surface reference pressure in Pascals

# Specify output pressure levels
new_levels = np.array([1000, 950, 800, 700, 600, 500, 400, 300, 200])  # in millibars
new_levels = new_levels * 100  # convert to Pascals

# Interpolate pressure coordinates form hybrid sigma coord
u_int = interp_hybrid_to_pressure(
    u, ps[0, :, :], hyam, hybm, p0=p0, new_levels=new_levels, method='log'
)

# Calculate zonal mean of u component of wind
uzon = u_int.mean(dim='lon')
Plot:
# Generate figure (set its size (width, height) in inches)
plt.figure(figsize=(7, 10))
ax = plt.axes()

# Format log axis
plt.yscale('log')
ax.yaxis.set_major_formatter(ScalarFormatter())

# Use geocat.viz.util convenience function to set axes parameters
gv.set_axes_limits_and_ticks(
    ax,
    ylim=(20000, 100000),
    yticks=[100000, 70000, 50000, 30000],
    yticklabels=['1000', '700', '500', '300'],
    xticks=np.arange(-60, 90, 30),
    xticklabels=['60S', '30S', '0', '30N', '60N'],
)

# Us geocat.viz.util convenience function to add minor and major ticks
gv.add_major_minor_ticks(ax, x_minor_per_major=3, y_minor_per_major=0, labelsize=16)

# Specify colormap
newcmap = cmaps.ncl_default

# Plot filed contours
p = uzon.plot.contourf(
    ax=ax,
    levels=13,
    vmin=-8,
    vmax=40,
    cmap=newcmap,
    add_colorbar=False,
    add_labels=False,
)

# Plot contour lines
uzon.plot.contour(
    ax=ax,
    levels=13,
    vmin=-8,
    vmax=40,
    colors='black',
    linewidths=0.5,
    linestyles='solid',
    add_labels=False,
)

# Create colorbar
cbar = plt.colorbar(
    p,
    ax=ax,
    drawedges=True,
    extendrect=True,
    extendfrac='auto',
    ticks=np.arange(-8, 44, 4),
    orientation='horizontal',
    pad=0.075,
    aspect=11,
)

# Set colorbar tick label size
cbar.ax.tick_params(labelsize=14)

# Use geocat.vix convenience function to set titles and labels
gv.set_titles_and_labels(
    ax,
    maintitle="Logarithmic axis",
    maintitlefontsize=18,
    lefttitle="Zonal Wind",
    lefttitlefontsize=16,
)

# Show plot
plt.show()
Total running time of the script: (0 minutes 0.236 seconds)