

Note
Go to the end to download the full example code.
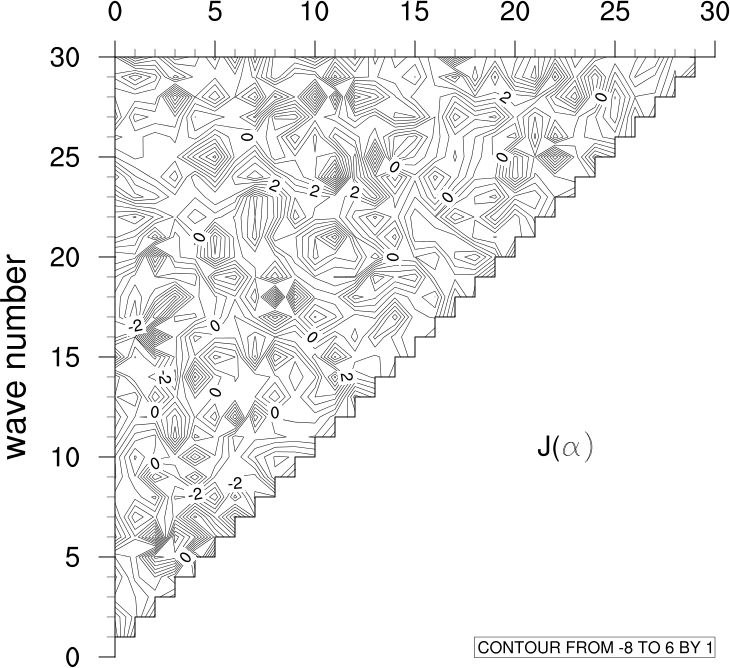
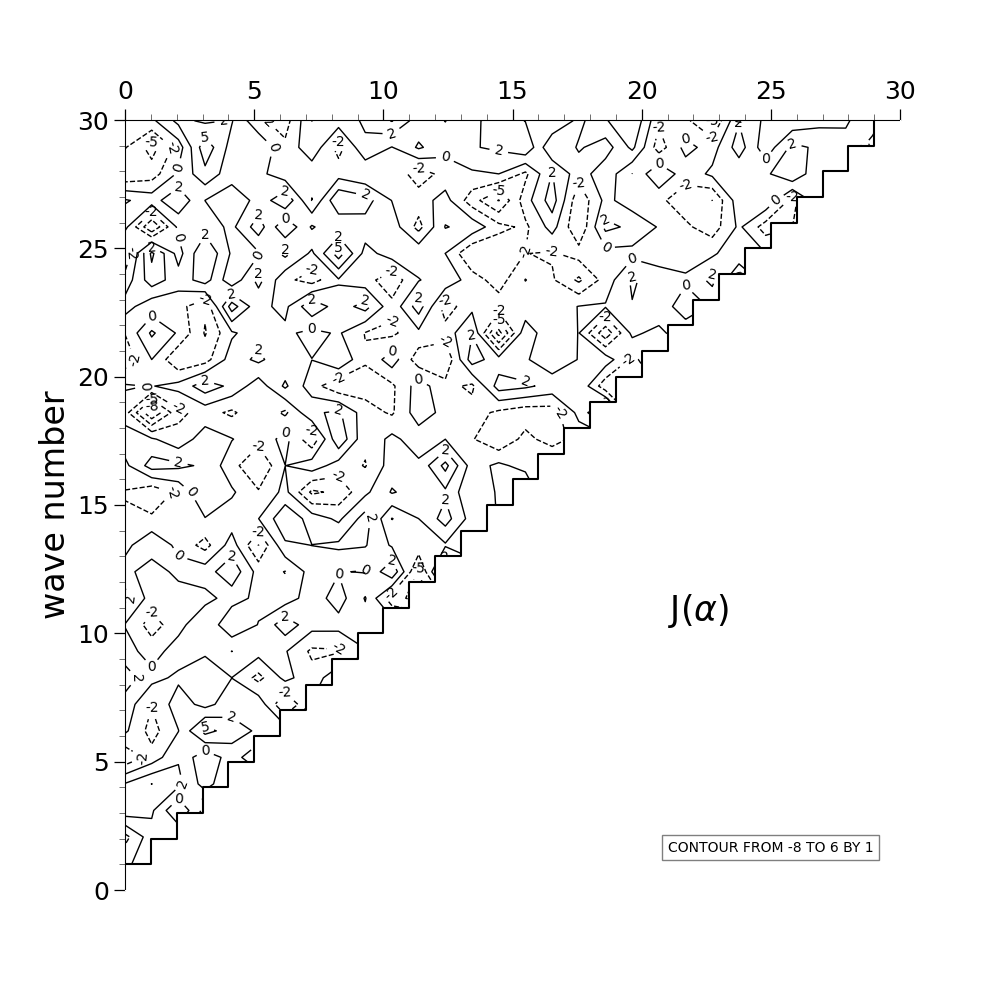
NCL_conwomap_3.py#
- Concepts illustrated:
Drawing a simple contour plot
Generating dummy data using “random_normal”
Drawing a filled polygon over area on a contour plot with missing data
Turning off the bottom and right borders of a contour plot
Changing the labels and tickmarks on a contour plot
Adding a complex Greek character to a contour plot
Moving the contour informational label into the plot
Forcing tickmarks and labels to be drawn on the top X axis in a contour plot
- See following URLs to see the reproduced NCL plot & script:
Original NCL script: https://www.ncl.ucar.edu/Applications/Scripts/conwomap_3.ncl
Original NCL plot: https://www.ncl.ucar.edu/Applications/Images/conwomap_3_lg.png
Import packages:
import numpy as np
import matplotlib.pyplot as plt

import geocat.viz as gv
Generate random data:
xlist = np.linspace(0, 31.0, 31)
ylist = np.linspace(0, 31.0, 31)
xdata, ydata = np.meshgrid(xlist, ylist)

zdata = np.random.normal(0, 3.0, size=(31, 31))
Create figure
plt.figure(figsize=(10, 10))

# Create axes
ax = plt.axes()

# Use geocat.viz.util convenience function to set axes limits & tick values without calling several matplotlib functions
gv.set_axes_limits_and_ticks(
    ax,
    xlim=(0, 30),
    ylim=(0, 30),
    xticks=None,
    yticks=None,
    xticklabels=None,
    yticklabels=None,
)

# Use geocat.viz.util to add major and minor tics
gv.add_major_minor_ticks(ax, x_minor_per_major=5, y_minor_per_major=5, labelsize=18)

# Use geocat.viz.util convenience function to add titles to left and right of the plot axis.
gv.set_titles_and_labels(ax, ylabel="wave number", labelfontsize=24)

# Set ticks and labels only on left and top of plot
ax.xaxis.tick_top()
ax.yaxis.tick_left()

# Set color of right and bottom axes to make them invisible
ax.spines['right'].set_color('white')
ax.spines['bottom'].set_color('white')

# Create a numpy array of the length of xlist
x = np.arange(0, len(xlist))

# Plot a step function
plt.step(x, x, color='black', zorder=7)

# Plot contour data
cp = ax.contour(xdata, ydata, zdata, colors='black', linewidths=1.0)

# Label contours
ax.clabel(cp, inline=True, fontsize=10, colors='black', fmt="%.0f")

# Ignore second half of the graph
y1 = np.full(shape=len(xlist), fill_value=0, dtype=np.int32)
y2 = x
ax.fill_between(
    x, y1, y2, where=y2 >= y1, color='white', step='pre', alpha=1.0, zorder=4
)

# Set properties for the text boxes
props1 = dict(facecolor='white', edgecolor='white', alpha=0.5)
props2 = dict(facecolor='white', edgecolor='black', alpha=0.5)

# Place first text box
ax.text(
    0.70,
    0.35,
    'J(${\u03b1}$)',
    transform=ax.transAxes,
    fontsize=25,
    bbox=props1,
    zorder=5,
)

# Place second text box
ax.text(
    0.70,
    0.05,
    'CONTOUR FROM -8 TO 6 BY 1',
    transform=ax.transAxes,
    fontsize=10,
    bbox=props2,
    zorder=5,
)

plt.show()
Total running time of the script: (0 minutes 0.411 seconds)