

Note
Go to the end to download the full example code.
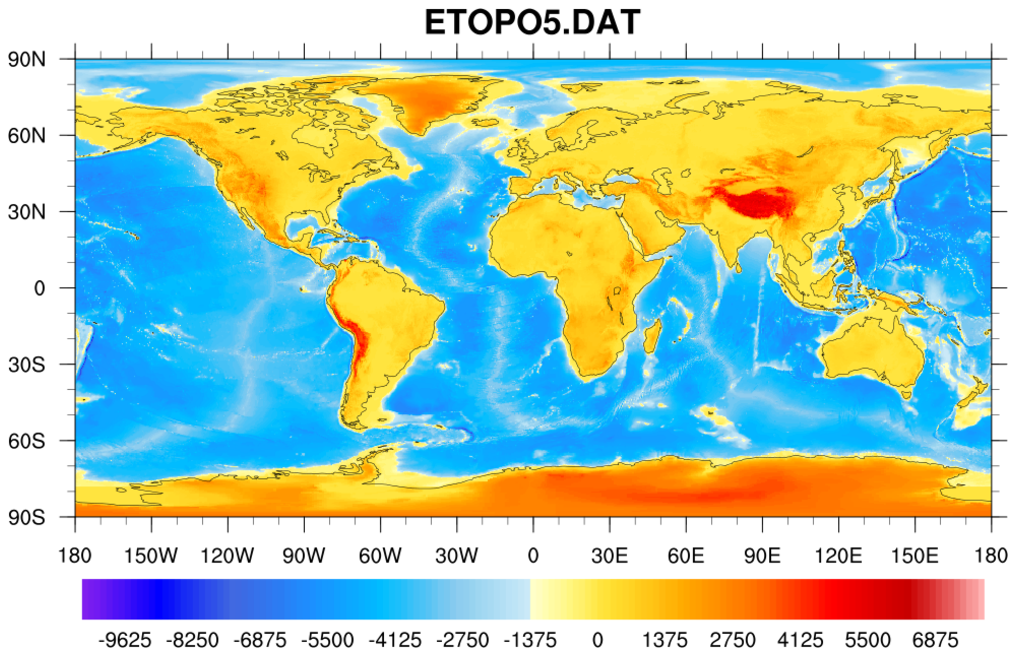
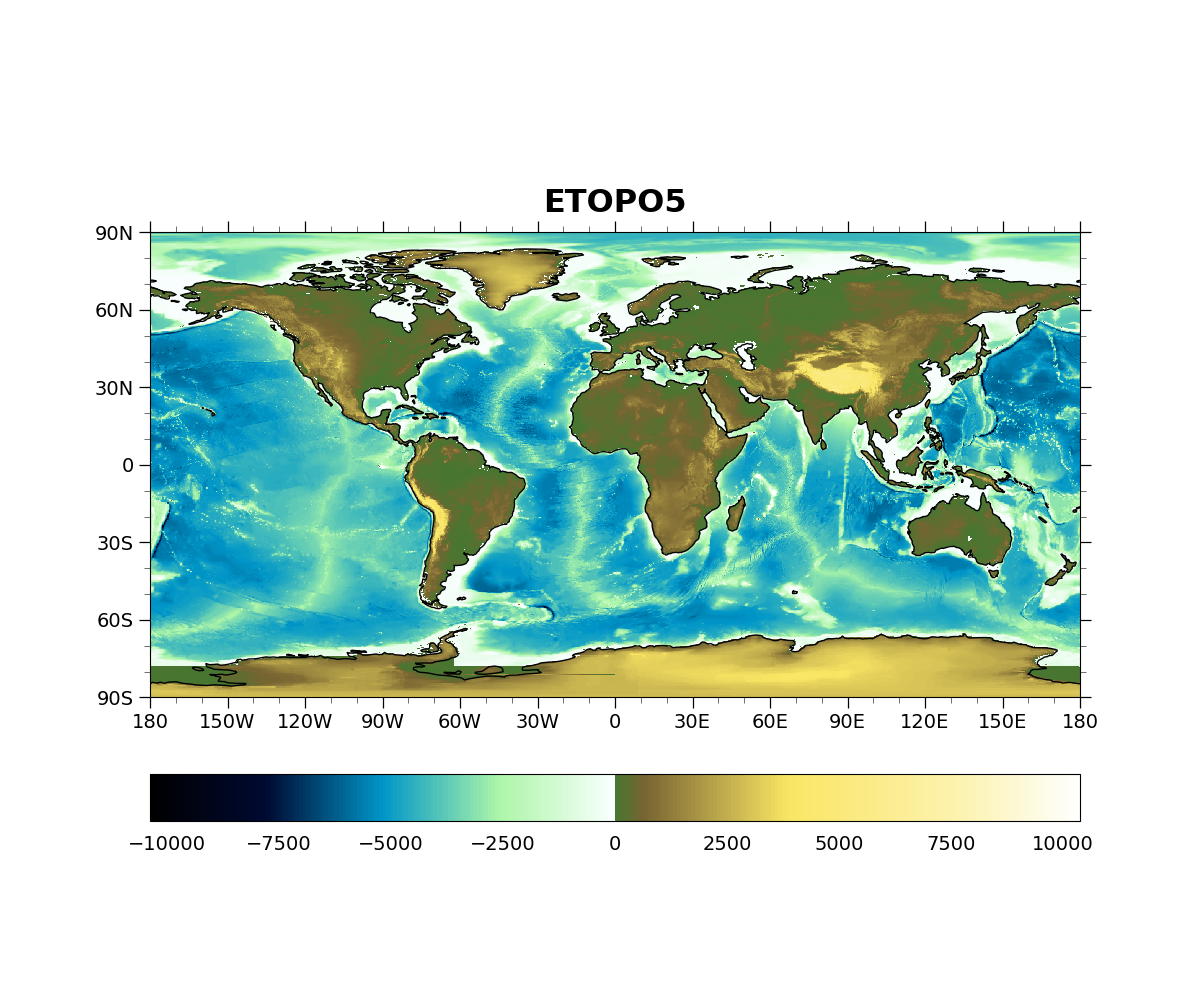
NCL_topo_1.py#
- This script illustrates the following concepts:
Drawing a topographic map using 5’ data
Drawing topographic data using GMT colormap
Reading binary data
Creating an xarray DataArray
- See following URLs to see the reproduced NCL plot & script:
Original NCL script: https://www.ncl.ucar.edu/Applications/Scripts/topo_1.ncl
Original NCL plot: https://www.ncl.ucar.edu/Applications/Images/topo_1_lg.png
Import packages:
import matplotlib.pyplot as plt
import xarray as xr
import numpy as np
import cartopy.crs as ccrs
from cartopy.mpl.gridliner import LongitudeFormatter, LatitudeFormatter
import cmaps

import geocat.datafiles as gdf
import geocat.viz as gv
Read in data:
# Open the dataset using numpy
nlat = 2160
nlon = 4320

elevation_data = np.fromfile(gdf.get("binary_files/ETOPO5.DAT"), dtype='>i2').reshape(
    (nlat, nlon)
)

# Create numpy arrays for latitude and longitude
lat = np.linspace(90, -90, nlat)
lon = np.linspace(0, 360, nlon)

# Create an xarray DataArray
da = xr.DataArray(
    data=elevation_data,
    dims=["lat", "lon"],
    coords=dict(
        lat=(["lat"], lat, {"long_name": "latitude"}),
        lon=(["lon"], lon, {"long_name": "longitude"}),
    ),
    name="elevation",
    attrs={"units": "m"},
)
Plot
# Generate figure and set size
plt.figure(figsize=(12, 10))

# Generate axes, using Cartopy
projection = ccrs.PlateCarree()
ax = plt.axes(projection=projection)

# Add coastlines
ax.coastlines(zorder=10)

# Plot the elevation data
elev = da.plot.imshow(
    ax=ax, transform=projection, cmap=cmaps.GMT_relief, add_colorbar=False
)

# Add colorbar
cbar = plt.colorbar(ax=ax, mappable=elev, orientation='horizontal', pad=0.1)
cbar.ax.tick_params(
    size=0, labelsize=14
)  # Remove the tick marks from the colorbar, set label size
cbar.ax.xaxis.set_tick_params(pad=10)

# Use geocat-viz utility function to format major and minor tick marks
gv.add_major_minor_ticks(ax, labelsize=14)

# Add title, remove default x and y labels
plt.title('ETOPO5', fontweight='bold', fontsize=23, pad=15)
plt.xlabel("")
plt.ylabel("")

# Use geocat-viz utility function to format x and y tick labels
gv.set_axes_limits_and_ticks(
    ax,
    xlim=[-180, 180],
    ylim=[-90, 90],
    xticks=np.arange(-180, 181, 30),
    yticks=np.arange(-90, 91, 30),
)

# Use geocat-viz utility function to add lat/lon formatting for tick labels
gv.add_lat_lon_ticklabels(ax)

# Remove degree symbol from lat/lon labels
ax.yaxis.set_major_formatter(LatitudeFormatter(degree_symbol=''))
ax.xaxis.set_major_formatter(LongitudeFormatter(degree_symbol=''))

# Show the plot
plt.show()
Total running time of the script: (0 minutes 4.390 seconds)