

Note
Go to the end to download the full example code.
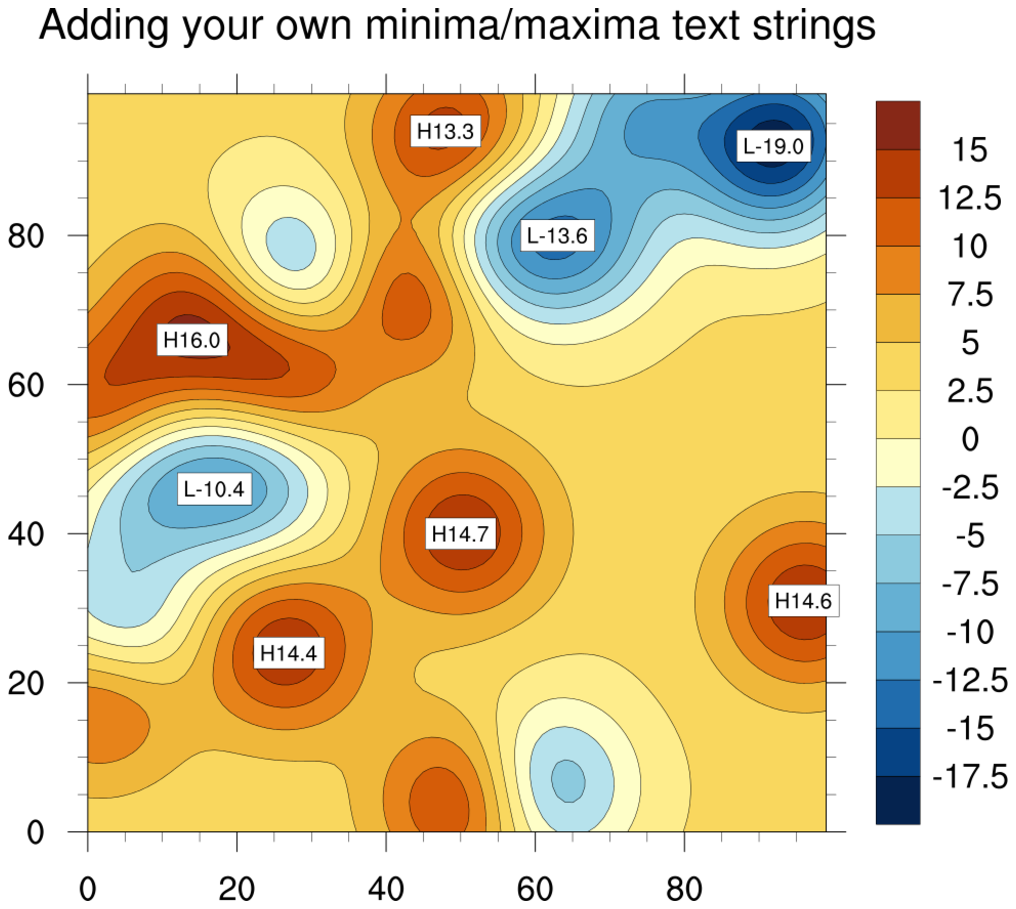
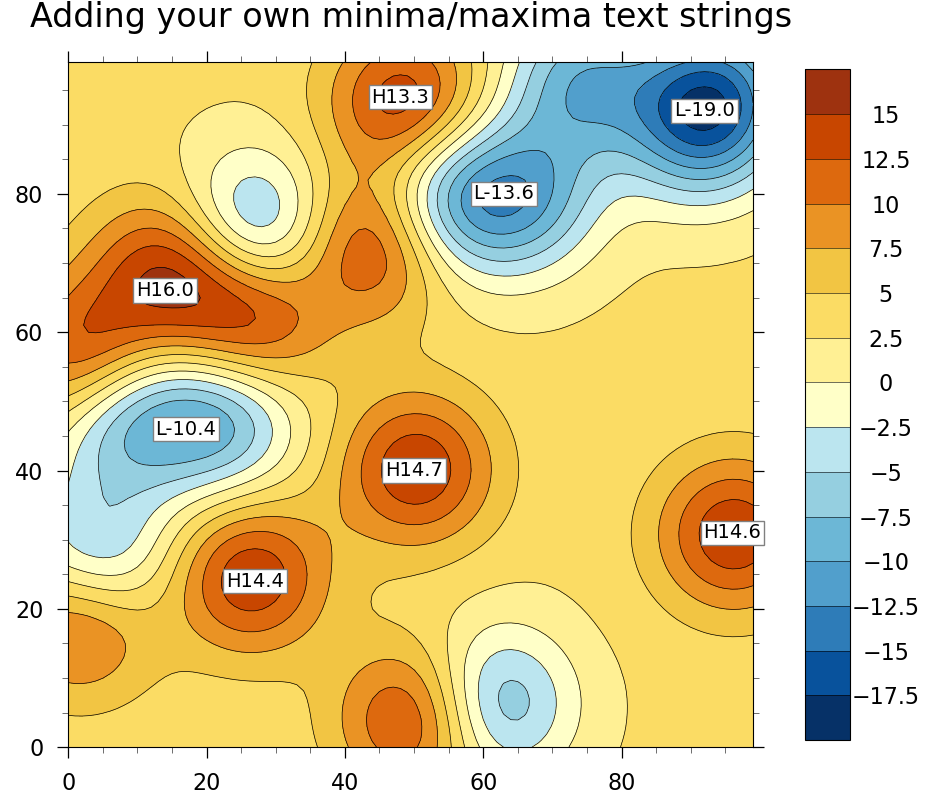
NCL_minmax_3.py#
- This script illustrates the following concepts:
Calculating the local minima/maxima of your data
Adding text strings at local minima/maxima locations
Generating dummy data using “generate_2d_array”
Setting the background color for a text box
Turning on the perimeter of a text box
- See following URLs to see the reproduced NCL plot & script:
Original NCL script: https://www.ncl.ucar.edu/Applications/Scripts/minmax_3.ncl
Original NCL plot: https://www.ncl.ucar.edu/Applications/Images/minmax_3_lg.png
Import packages:
import numpy as np
import xarray as xr
import matplotlib.pyplot as plt
import geocat.viz as gv
import cmaps
Definition of generate_2d_array and helper functions adapted from NCAR/pyngl
#  Globals for random number generator for generate_2d_array
dfran_iseq = 0
dfran_rseq = [
    0.749,
    0.973,
    0.666,
    0.804,
    0.081,
    0.483,
    0.919,
    0.903,
    0.951,
    0.960,
    0.039,
    0.269,
    0.270,
    0.756,
    0.222,
    0.478,
    0.621,
    0.063,
    0.550,
    0.798,
    0.027,
    0.569,
    0.149,
    0.697,
    0.451,
    0.738,
    0.508,
    0.041,
    0.266,
    0.249,
    0.019,
    0.191,
    0.266,
    0.625,
    0.492,
    0.940,
    0.508,
    0.406,
    0.972,
    0.311,
    0.757,
    0.378,
    0.299,
    0.536,
    0.619,
    0.844,
    0.342,
    0.295,
    0.447,
    0.499,
    0.688,
    0.193,
    0.225,
    0.520,
    0.954,
    0.749,
    0.997,
    0.693,
    0.217,
    0.273,
    0.961,
    0.948,
    0.902,
    0.104,
    0.495,
    0.257,
    0.524,
    0.100,
    0.492,
    0.347,
    0.981,
    0.019,
    0.225,
    0.806,
    0.678,
    0.710,
    0.235,
    0.600,
    0.994,
    0.758,
    0.682,
    0.373,
    0.009,
    0.469,
    0.203,
    0.730,
    0.588,
    0.603,
    0.213,
    0.495,
    0.884,
    0.032,
    0.185,
    0.127,
    0.010,
    0.180,
    0.689,
    0.354,
    0.372,
    0.429,
]


#  Random number generator for generate_2d_array.
def _dfran():
    global dfran_iseq
    global dfran_rseq
    dfran_iseq = dfran_iseq % 100
    r = dfran_rseq[dfran_iseq]
    dfran_iseq = dfran_iseq + 1
    return r


def generate_2d_array(dims, num_low, num_high, minv, maxv, seed=0):
    """Generates a "nice" 2D array of pseudo random data, especially for use in
    2D graphics.

    This function has the same effect as NCL generate_2d_array.

    Parameters
    ----------
    dims : tuple, list or array, int
        Dimensions of the two-dimensional array to be returned.
    num_low, num_high : int
        Integers representing the approximate minimum and maximum number of highs and lows
        that the output array will have. They must be in the range 1 to 25.
        If not, then they will be set to either 1 or 25.
    minv, maxv : float
        The exact minimum and maximum values that the output array will have.
    iseed : int, default to 0
        An optional argument specifying a seed for the random number generator.
        If iseed is outside the range 0 to 99, it will be set to 0.

    Returns
    -------
    out_array : numpy.ndarray
        A 2D array of pseudo random data.
    """

    # Globals for random numbers
    global dfran_iseq
    dfran_iseq = seed

    #  Dims are reversed in order to get the same results as the NCL function.
    nx = int(dims[1])
    ny = int(dims[0])
    # Column-major (Fortran-style) order in memory
    out_array = np.zeros([nx, ny], 'f')
    tmp_array = np.zeros([3, 25], 'f')
    fovm = 9.0 / float(nx)
    fovn = 9.0 / float(ny)
    # Make sure that num_low and num_high are between 1 to 25 inclusive
    nlow = max(1, min(25, num_low))
    nhgh = max(1, min(25, num_high))
    ncnt = nlow + nhgh

    # Fill up the temporary array
    for k in range(num_low):
        # lows at random locations.
        tmp_array[0, k] = 1.0 + (float(nx) - 1.0) * _dfran()
        tmp_array[1, k] = 1.0 + (float(ny) - 1.0) * _dfran()
        tmp_array[2, k] = -1.0
    for k in range(num_low, num_low + num_high):
        # highs at random locations.
        tmp_array[0, k] = 1.0 + (float(nx) - 1.0) * _dfran()
        tmp_array[1, k] = 1.0 + (float(ny) - 1.0) * _dfran()
        tmp_array[2, k] = 1.0

    # Initialize dmin and dmax to positive and negative infinity
    dmin = np.inf
    dmax = -np.inf
    # Initialize all values in out_array to average of minv and maxv
    midpt = 0.5 * (minv + maxv)
    out_array[:] = midpt

    # Populate out_array
    for j in range(ny):
        for i in range(nx):
            for k in range(ncnt):
                tempi = fovm * (float(i + 1) - tmp_array[0, k])
                tempj = fovn * (float(j + 1) - tmp_array[1, k])
                temp = -(np.square(tempi) + np.square(tempj))
                if temp >= -20.0:
                    out_array[i, j] = out_array[i, j] + 0.5 * (maxv - minv) * tmp_array[
                        2, k
                    ] * np.exp(temp)
            dmin = min(dmin, out_array[i, j])
            dmax = max(dmax, out_array[i, j])

    out_array = (((out_array - dmin) / (dmax - dmin)) * (maxv - minv)) + minv
    out_array = np.transpose(out_array, [1, 0])

    del tmp_array

    return out_array
Helper function to add contour labels of local extrema with bounding boxes
def plotLabels(coord_locations, label):
    # Find contour value based on longitude and latitude coordinates
    for coord in coord_locations:
        # Note: second item of coord (lat) accesses the index for the row number,
        # and first item of coord (lon) access the index for the column number
        value = round(data.data[coord[1], coord[0]], 1)

        txt = ax.text(
            coord[0],
            coord[1],
            label + str(value),
            fontsize=14,
            horizontalalignment='center',
            verticalalignment='center',
        )
        txt.set_bbox(dict(facecolor='w', edgecolor='gray', pad=2))
Generate dummy data
nx = 100
ny = 100

data = generate_2d_array((nx, ny), 10, 10, -19.0, 16.0, 0)

# Convert data into type xarray.DataArray
data = xr.DataArray(
    data, dims=["lat", "lon"], coords=dict(lat=np.arange(nx), lon=np.arange(ny))
)
Plot:
# Generate figure (set its size (width, height) in inches)
plt.figure(figsize=(9.5, 8))

# Generate axes
ax = plt.axes()

# Set contour levels
levels = np.arange(-20, 18.5, 2.5)

# Plot data and create colorbar
cmap = cmaps.BlueYellowRed

# Plot filled contour and contour lines
contours = ax.contourf(data, cmap=cmap, levels=levels)
lines = ax.contour(contours, linewidths=0.5, linestyles='solid', colors='black')

# Find local min/max extrema with GeoCAT-Viz find_local_extrema
lmin = gv.find_local_extrema(data, eType='Low', highVal=12, lowVal=-10, eps=7)
lmax = gv.find_local_extrema(data, eType='High', highVal=12, lowVal=-10, eps=7)

# Plot labels for local extrema
plotLabels(lmin, 'L')
plotLabels(lmax, 'H')

# Add colorbar
cbar = plt.colorbar(
    contours,
    ax=ax,
    orientation='vertical',
    shrink=0.96,
    pad=0.06,
    extendrect=True,
    extendfrac='auto',
    aspect=15,
    drawedges=True,
    ticks=levels[1:-1:],
)  # set colorbar levels

# Set every other tick labels to be integers
ticklabs = cbar.ax.get_yticklabels()
[ticklabs[i].set_text(ticklabs[i].get_text()[:-2]) for i in range(1, len(ticklabs), 2)]

# Center align colorbar tick labels
cbar.ax.set_yticklabels(ticklabs, ha='center')
cbar.ax.yaxis.set_tick_params(pad=26, length=0, labelsize=16)

# Use geocat.viz.util convenience function to set axes limits & tick values without calling several matplotlib functions
gv.set_axes_limits_and_ticks(
    ax,
    xlim=(0, 99),
    ylim=(0, 99),
    xticks=np.arange(0, 100, 20),
    yticks=np.arange(0, 100, 20),
)

# Use geocat.viz.util convenience function to add minor and major tick lines
gv.add_major_minor_ticks(ax, x_minor_per_major=4, y_minor_per_major=4, labelsize=16)

# Use geocat.viz.util convenience function to add titles to left and right of the plot axis.
gv.set_titles_and_labels(
    ax, maintitle='Adding your own minima/maxima text strings', maintitlefontsize=24
)

# Set different tick font sizes and padding for X and Y axis
ax.tick_params(axis='both', pad=10)

# Set axes to be square
ax.set_aspect(aspect='equal')

# Show plot
plt.tight_layout()
plt.show()
Total running time of the script: (0 minutes 0.504 seconds)