

Note
Go to the end to download the full example code.
NCL_maponly_2.py#
- This script illustrates the following concepts:
Outlining continents
Turning on map country boundaries
Changing the color of map outlines
Changing the scale of country boundaries
Zooming in on a particular area
- See following URLs to see the reproduced NCL plot & script:
Import packages
import numpy as np
import cartopy.crs as ccrs
import cartopy.feature as cfeature
import matplotlib.pyplot as plt

import geocat.viz as gv
Plot:
def map_plot(scale, long_min, long_max, lat_min, lat_max, long_labels, lat_labels):
"""Plots a map-only figure with continent borders, country borders, and
lakes at a certain longitude and latitude.
Parameters
----------
scale : :obj:'str':
scale of continent borders and lakes
long_min : :obj:'int':
minimum longitude for plotting
long_max : :obj:'int':
maximum longitude for plotting
lat_min : :obj:'int':
minimum latitude for plotting
lat_max : :obj:'int':
maximum latitude for plotting
long_labels : :obj:'list':
list of tick labels for x axis
lat_labels : :obj:'list':
list of tick labels for y axis
Description
-----------
Plots a figure with longitude with range long_min to long_max and latitude with
range from lat_min to lat_max. The scale of the continent borders and
lakes depends on the scale variable. The latitude labels are set by lat_labels.
"""
# Define the projection and generate axes using Cartopy
projection = ccrs.PlateCarree()
# Generate figure with (width, height) in inches
fig = plt.figure(figsize=(7, 7))
ax = plt.axes(projection=projection)
# Add in country borders, continent borders, and lakes
ax.add_feature(
cfeature.NaturalEarthFeature(
category='cultural',
name="admin_0_countries",
scale="110m",
facecolor="none",
edgecolor="black",
linewidth=0.2,
)
)
ax.add_feature(
cfeature.LAND.with_scale(scale), edgecolor="#4141a0", facecolor="none"
)
ax.add_feature(
cfeature.LAKES.with_scale(scale), edgecolor="#4141a0", facecolor="none"
)
# Set extent to show particular area of the map
ax.set_extent((long_min, long_max, lat_min, lat_max), crs=projection)
# Use geocat.viz.util convenience function to add minor and major tick lines
gv.add_major_minor_ticks(ax, x_minor_per_major=3, y_minor_per_major=3, labelsize=15)
# Use geocat.viz.util convenience function to set axes parameters without calling several matplotlib functions
# Set axes limits, tick values, and tick labels for both latitude and longitude
gv.set_axes_limits_and_ticks(
ax,
xlim=(long_min, long_max),
ylim=(lat_min, lat_max),
xticks=np.linspace(long_min, long_max + 20, 4),
yticks=np.linspace(lat_min, lat_max, 4),
xticklabels=long_labels,
yticklabels=lat_labels,
)
# Show plot with minimal whitespace
plt.tight_layout()
plt.show()
# Latitude and longitude labels for the top subplot
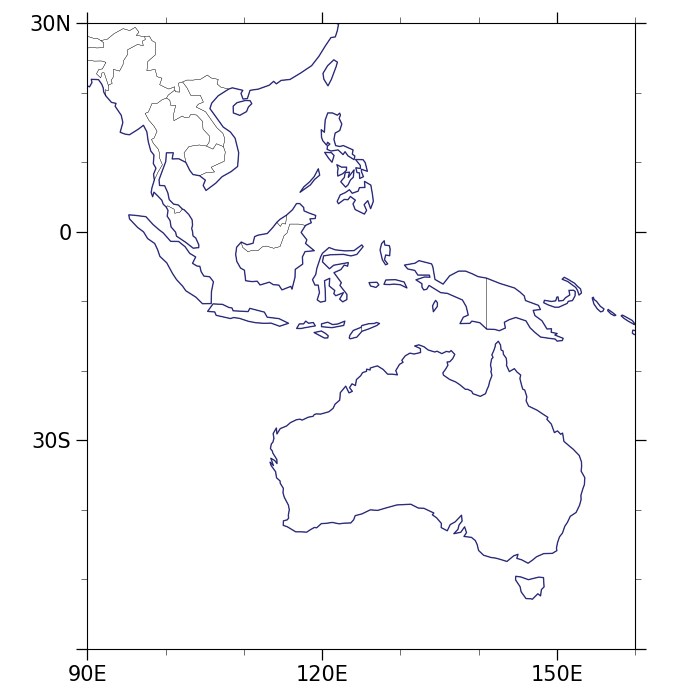
plt1_long_labels = ["90E", "120E", "150E", ""]
plt1_lat_labels = ["", "30S", "0", "30N"]
# Latitude and longitude labels for the middle and bottom subplots
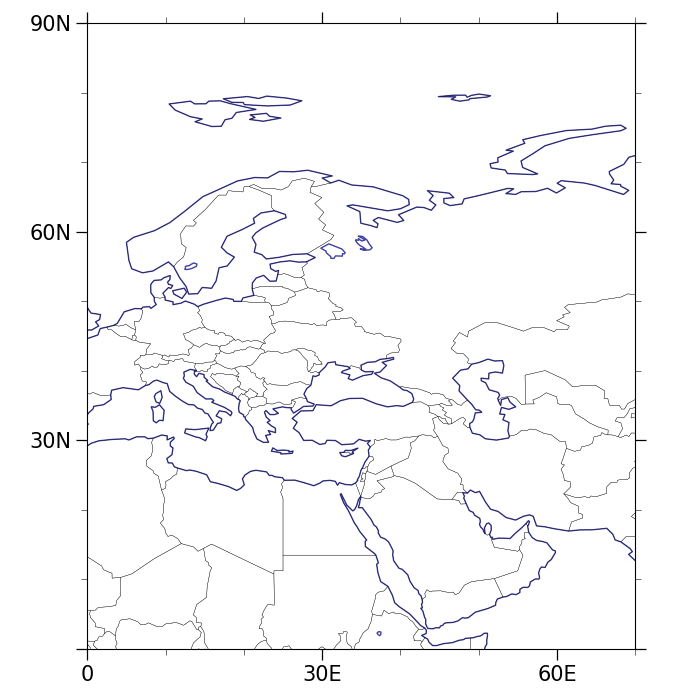
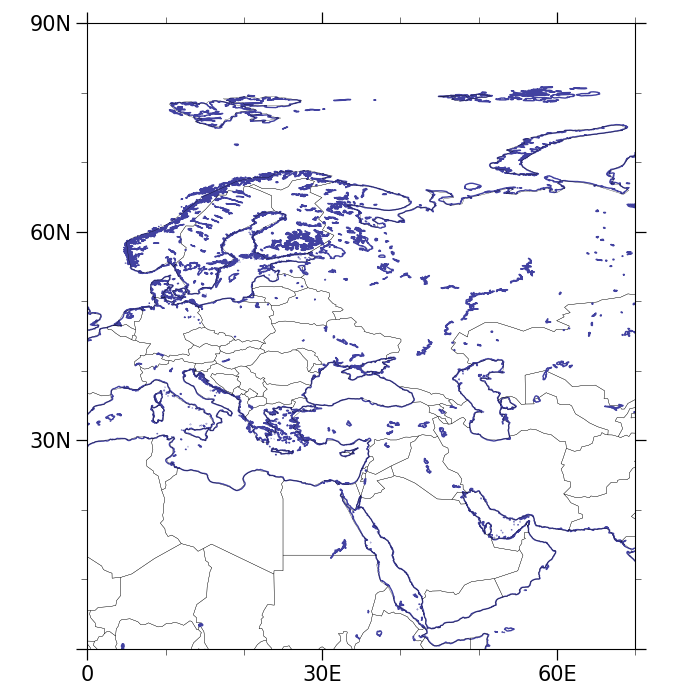
plt23_long_labels = ["0", "30E", "60E", ""]
plt23_lat_labels = ["", "30N", "60N", "90N"]
# Plot all three subplots
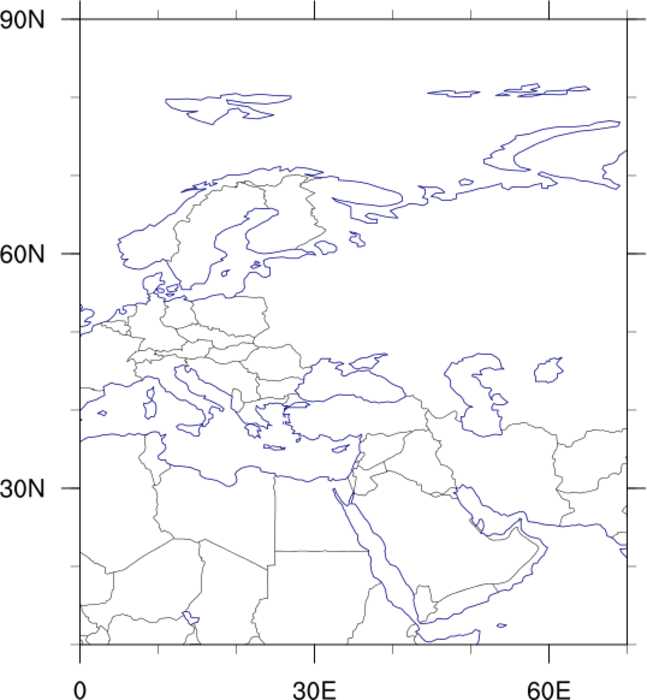
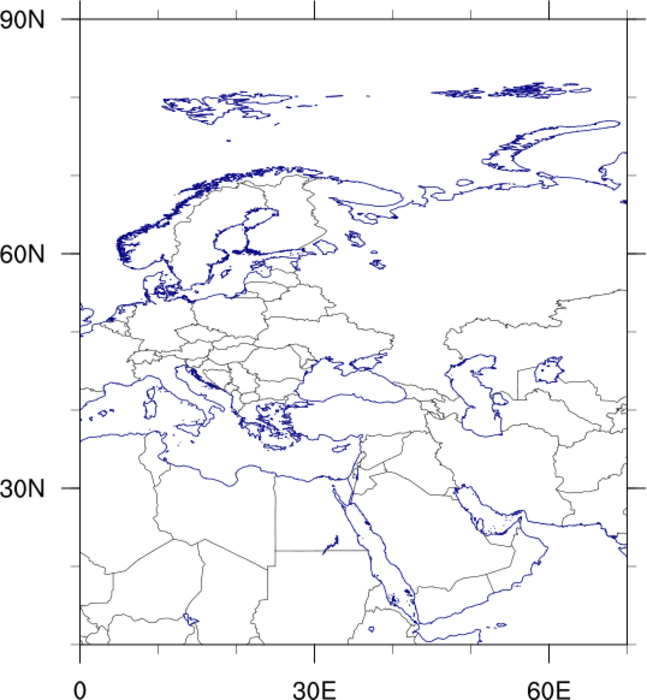
map_plot('110m', 90, 160, -50, 30, plt1_long_labels, plt1_lat_labels)
map_plot('110m', 0, 70, 10, 90, plt23_long_labels, plt23_lat_labels)
map_plot('10m', 0, 70, 10, 90, plt23_long_labels, plt23_lat_labels)
Total running time of the script: (0 minutes 1.760 seconds)