

Note
Go to the end to download the full example code.
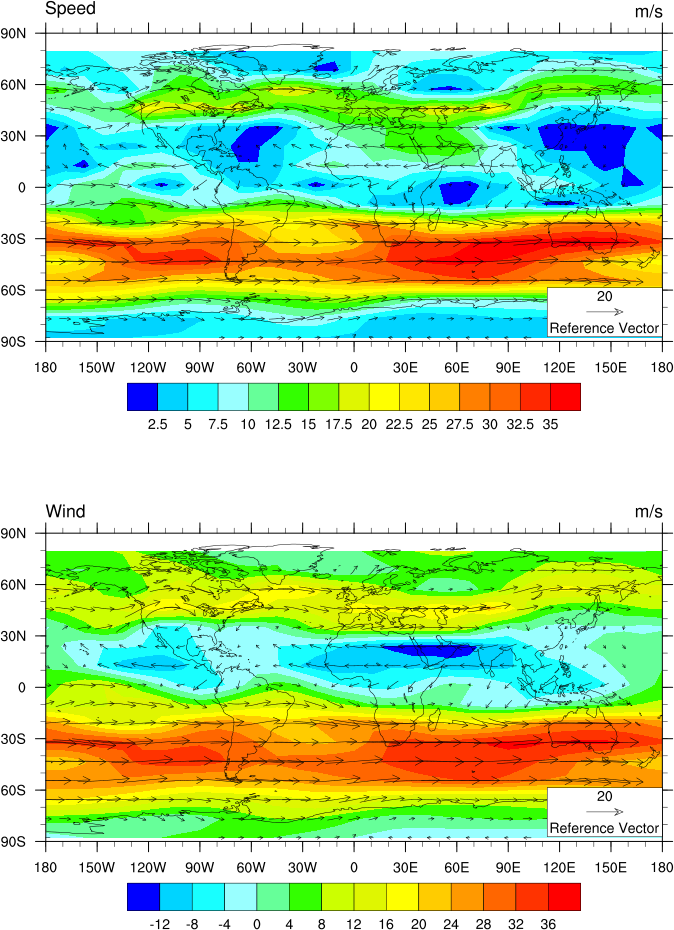
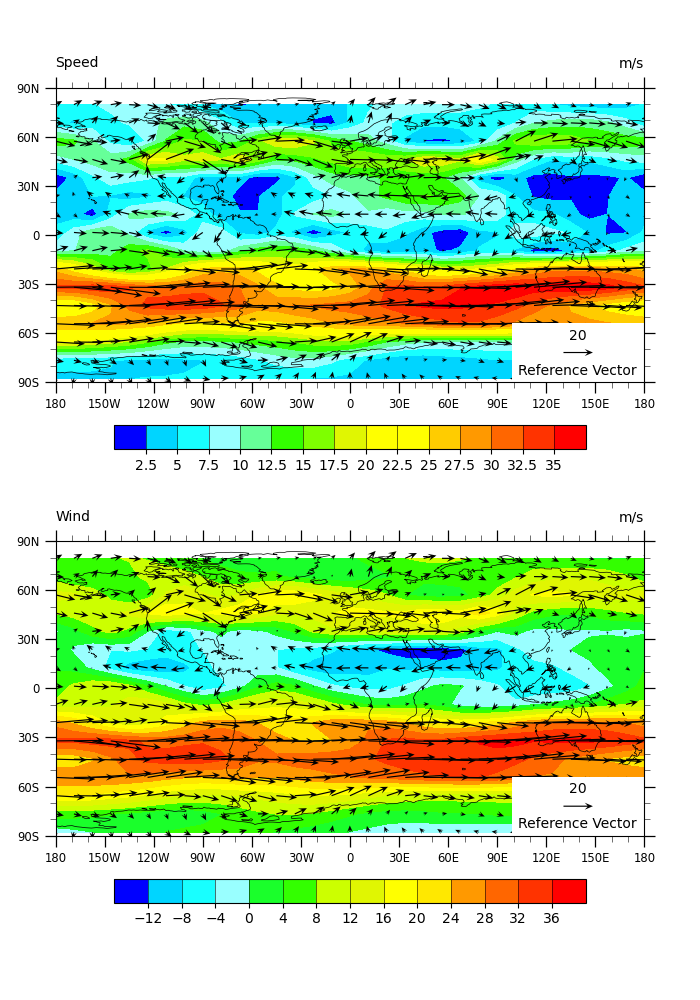
NCL_panel_13.py#
- This script illustrates the following concepts:
Overlaying a vector field over filled contours
Paneling two plots vertically
- See following URLs to see the reproduced NCL plot & script:
Original NCL script: http://www.ncl.ucar.edu/Applications/Scripts/panel_13.ncl
Original NCL plot: http://www.ncl.ucar.edu/Applications/Images/panel_13_lg.png
- Note:
Due to differences in how NCL and Python scale glyphs in vector fields, the smallest vectors in the Python version are much harder to read than in the NCL version. An issue has been opened on the geoCAT examples gallery github so this can be addressed at a later date.
Import packages:
import cartopy.crs as ccrs
from cartopy.mpl.gridliner import LongitudeFormatter, LatitudeFormatter
import matplotlib.pyplot as plt
from matplotlib.ticker import FormatStrFormatter
import matplotlib.patches as mpatches
import numpy as np
import xarray as xr
import cmaps

import geocat.datafiles as gdf
import geocat.viz as gv
Read in data:
# Open a netCDF data file using xarray default engine and load the data into xarrays
ds = xr.open_dataset(gdf.get("netcdf_files/uv300.nc"))

# Extract data from second timestep
ds = ds.isel(time=1, drop=True)

# Ensure longitudes range from 0 to 360 degrees
U = gv.xr_add_cyclic_longitudes(ds.U, "lon")
V = gv.xr_add_cyclic_longitudes(ds.V, "lon")

# Thin data to only include every fourth value
U = U[::4, ::4]
V = V[::4, ::4]

# Calculate the magnitude of the winds
magnitude = np.sqrt(U.data**2 + V.data**2)
Plot:
# Create subplots and specify their projections
projection = ccrs.PlateCarree()
fig, axs = plt.subplots(2, 1, figsize=(7, 10), subplot_kw={"projection": projection})
plt.tight_layout(pad=4, h_pad=7)

# Add coastlines, the zorder keyword specifies the order in which the elements
# are drawn where elements with lower zorder values are drawn first
axs[0].coastlines(linewidth=0.5, zorder=1)
axs[1].coastlines(linewidth=0.5, zorder=1)

# Use geocat.viz.util convenience function to set axes tick values
gv.set_axes_limits_and_ticks(
    axs[0],
    xlim=[-180, 180],
    ylim=[-90, 90],
    xticks=np.arange(-180, 181, 30),
    yticks=np.arange(-90, 91, 30),
)
gv.set_axes_limits_and_ticks(
    axs[1],
    xlim=[-180, 180],
    ylim=[-90, 90],
    xticks=np.arange(-180, 181, 30),
    yticks=np.arange(-90, 91, 30),
)

# Use geocat.viz.util convenience function to add minor and major tick lines
gv.add_major_minor_ticks(axs[0])
gv.add_major_minor_ticks(axs[1])

# Use geocat.viz.util convenience function to make plots look like NCL plots by
# using latitude, longitude tick labels
gv.add_lat_lon_ticklabels(axs[0])
gv.add_lat_lon_ticklabels(axs[1])
# Remove the degree symbol from tick labels
axs[0].yaxis.set_major_formatter(LatitudeFormatter(degree_symbol=''))
axs[0].xaxis.set_major_formatter(LongitudeFormatter(degree_symbol=''))
axs[1].yaxis.set_major_formatter(LatitudeFormatter(degree_symbol=''))
axs[1].xaxis.set_major_formatter(LongitudeFormatter(degree_symbol=''))

# Use geocat.viz.util convenience function to set titles and labels
gv.set_titles_and_labels(
    axs[0],
    lefttitle='Speed',
    lefttitlefontsize=10,
    righttitle=U.units,
    righttitlefontsize=10,
)
gv.set_titles_and_labels(
    axs[1],
    lefttitle='Wind',
    lefttitlefontsize=10,
    righttitle=U.units,
    righttitlefontsize=10,
)

# Load in colormap
newcmap = cmaps.gui_default

# Specify contour levels and contour ticks
speed_levels = np.arange(0, 40, 2.5)
speed_ticks = np.arange(2.5, 37.5, 2.5)
wind_levels = np.arange(-16, 44, 4)
wind_ticks = np.arange(-12, 40, 4)

# Plot filled contours
speed = axs[0].contourf(
    U['lon'], U['lat'], magnitude, levels=speed_levels, cmap=newcmap, zorder=0
)
wind = axs[1].contourf(
    U['lon'], U['lat'], U.data, levels=wind_levels, cmap=newcmap, zorder=0
)

# Create color bars
speed_cbar = plt.colorbar(
    speed,
    ax=axs[0],
    orientation='horizontal',
    ticks=speed_ticks,
    shrink=0.8,
    drawedges=True,
    pad=0.1,
)
plt.colorbar(
    wind,
    ax=axs[1],
    orientation='horizontal',
    ticks=wind_ticks,
    shrink=0.8,
    drawedges=True,
    pad=0.1,
)
# Remove trailing zeros from speed color bar tick labels
speed_cbar.ax.xaxis.set_major_formatter(FormatStrFormatter('%g'))

# Plotting vector field
quiver_speed = axs[0].quiver(
    U['lon'],
    U['lat'],
    U.data,
    V.data,
    scale=400,
    width=0.002,
    headwidth=6,
    headlength=7,
    zorder=2,
)
quiver_wind = axs[1].quiver(
    U['lon'],
    U['lat'],
    U.data,
    V.data,
    scale=400,
    width=0.002,
    headwidth=6,
    headlength=7,
    zorder=2,
)

# Add white box to go behind reference vector
axs[0].add_patch(
    mpatches.Rectangle(
        xy=[0.775, 0],
        width=0.225,
        height=0.2,
        facecolor='white',
        transform=axs[0].transAxes,
        zorder=2,
    )
)
axs[1].add_patch(
    mpatches.Rectangle(
        xy=[0.775, 0],
        width=0.225,
        height=0.2,
        facecolor='white',
        transform=axs[1].transAxes,
        zorder=2,
    )
)
# Add reference vector and label
axs[0].quiverkey(quiver_speed, 0.8875, 0.1, 20, 20, zorder=2)
axs[1].quiverkey(quiver_wind, 0.8875, 0.1, 20, 20, zorder=2)
axs[0].text(0.785, 0.025, "Reference Vector", transform=axs[0].transAxes, zorder=2)
axs[1].text(0.785, 0.025, "Reference Vector", transform=axs[1].transAxes, zorder=2)

plt.show()
Total running time of the script: (0 minutes 0.383 seconds)