

Note
Go to the end to download the full example code.
NCL_polyg_14.py#
- This script illustrates the following concepts:
Drawing polylines and markers using great circle paths
Using geographiclib to calculate a great circle path
Attaching polylines and markers to a map plot
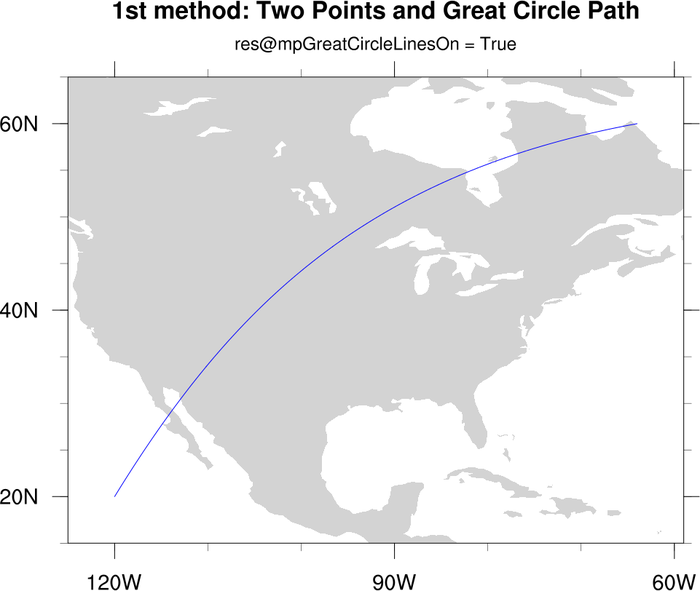
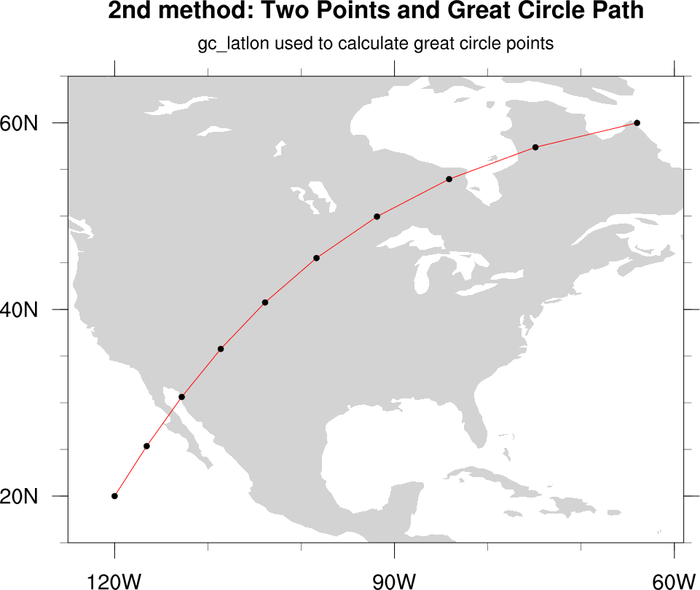
- See following URLs to see the reproduced NCL plot & script:
# Import packages:

import numpy as np
import cartopy.crs as ccrs
import matplotlib.pyplot as plt
import cartopy.feature as cfeature
from geographiclib.geodesic import Geodesic
from cartopy.mpl.gridliner import LongitudeFormatter, LatitudeFormatter

import geocat.viz as gv
Plot
def Plot(color, ext, xext, yext, npts, title, subt, style, pt):
"""Helper function to create two similar plots where color, extent, title,
line style, and marker style can all be customized on the same style map
projection.
Args:
color (:class: 'str'):
color for line on map in format 'color'
ext (:class: 'list'):
extent of the projection view in format [minlon, maxlon, minlat, maxlat]
xext (:class: 'list'):
start and stop points for curve in format [startlon, stoplon]
yext (:class: 'list'):
start and stop points for curve in format [startlat, stoplat]
title (:class: 'str'):
title of graph in format "Title"
style (:class: 'str'):
line style in format 'style'
pt (:class: 'str'):
marker type in format 'type'
"""
plt.figure(figsize=(8, 8))
ax = plt.axes(projection=ccrs.PlateCarree())
ax.set_extent(ext, ccrs.PlateCarree())
ax.add_feature(cfeature.LAND, color="lightgrey")
# This gets geodesic between the two points
# WGS84 ellipsoid is used
# yext and xext refer to the start and stop points for the curve
# [0] being start, [1] being stop
gl = Geodesic.WGS84.InverseLine(yext[0], xext[0], yext[1], xext[1])
npoints = npts
# Compute points on the geodesic, and plot them
# gl.s13 is the total length of the geodesic
# the points are equally spaced by 'true distance', but visually
# there is a slight distortion due to curvature/projection style
lons = []
lats = []
for ea in np.linspace(0, gl.s13, npoints):
g = gl.Position(ea, Geodesic.STANDARD | Geodesic.LONG_UNROLL)
lon2 = g["lon2"]
lat2 = g["lat2"]
lons.append(lon2)
lats.append(lat2)
plt.plot(lons, lats, style, color=color, transform=ccrs.Geodetic())
ax.plot(lons, lats, pt, transform=ccrs.PlateCarree())
plt.suptitle(title, y=0.90, fontsize=16)
# Use geocat.viz.util convenience function to set axes parameters without calling several matplotlib functions
# Set axes limits, and tick values
gv.set_axes_limits_and_ticks(
ax,
xlim=(-125, -60),
ylim=(15, 65),
xticks=np.linspace(-180, 180, 13),
yticks=np.linspace(0, 80, 5),
)
# Use geocat.viz.util convenience function to make plots look like NCL plots by using latitude, longitude tick labels
gv.add_lat_lon_ticklabels(ax)
# Remove the degree symbol from tick labels
ax.yaxis.set_major_formatter(LatitudeFormatter(degree_symbol=""))
ax.xaxis.set_major_formatter(LongitudeFormatter(degree_symbol=""))
# Use geocat.viz.util convenience function to add minor and major tick lines
gv.add_major_minor_ticks(ax, labelsize=12)
# Use geocat.viz.util convenience function to set titles and labels without calling several matplotlib functions
gv.set_titles_and_labels(
ax, maintitle=subt, maintitlefontsize=12, xlabel="", ylabel=""
)
plt.show()
# plot first color map
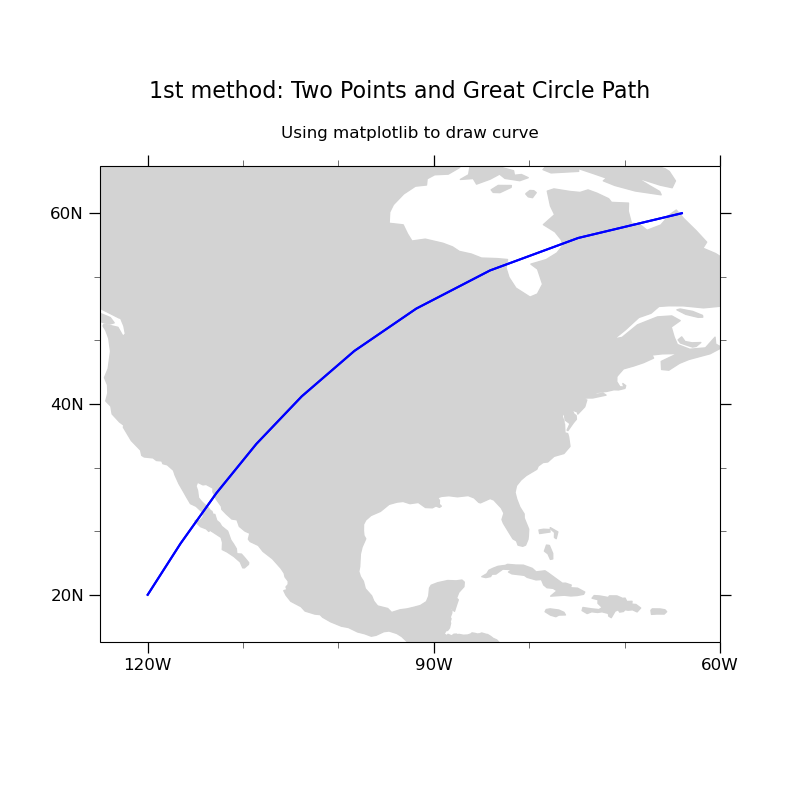
Plot(
"blue",
[-125, -60, 15, 65],
[-120, -64],
[20, 60],
10,
"1st method: Two Points and Great Circle Path",
"Using matplotlib to draw curve",
"-",
"blue",
)
# plot second color map
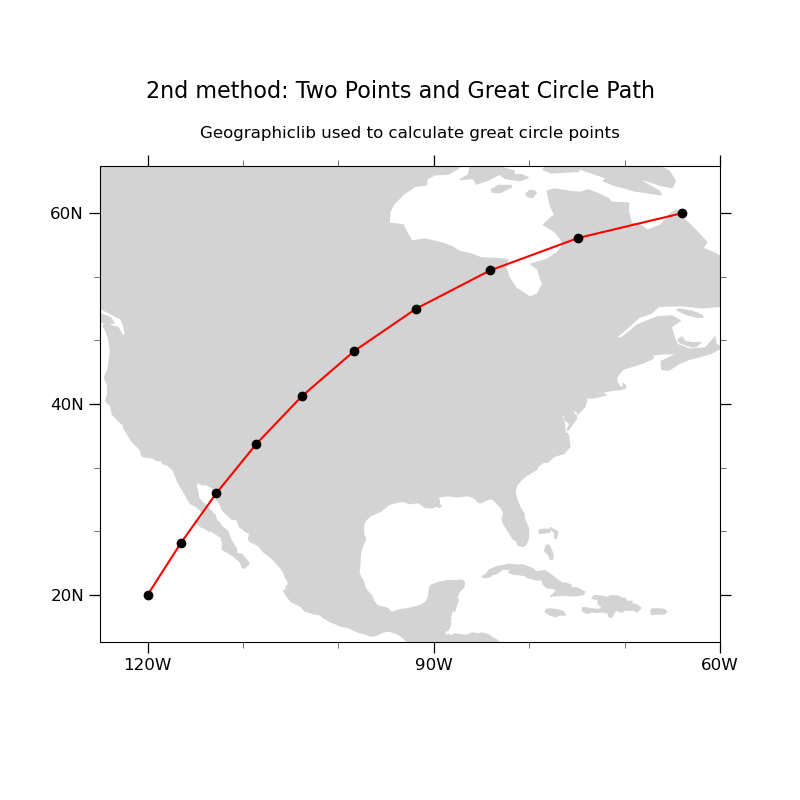
Plot(
"red",
[-125, -60, 15, 65],
[-120, -64],
[20, 60],
10,
"2nd method: Two Points and Great Circle Path",
"Geographiclib used to calculate great circle points",
"-",
"ko",
)
Total running time of the script: (0 minutes 0.122 seconds)