

Note
Go to the end to download the full example code.
NCL_pdf_1.py#
- This script illustrates the following concepts:
Generating univariate probability distributions
Generating PDFs of each sample distribution
Paneling two plots horizontally on a page
Modifying tick placement with matplotlib.ticker
- See following URLs to see the reproduced NCL plot & script:
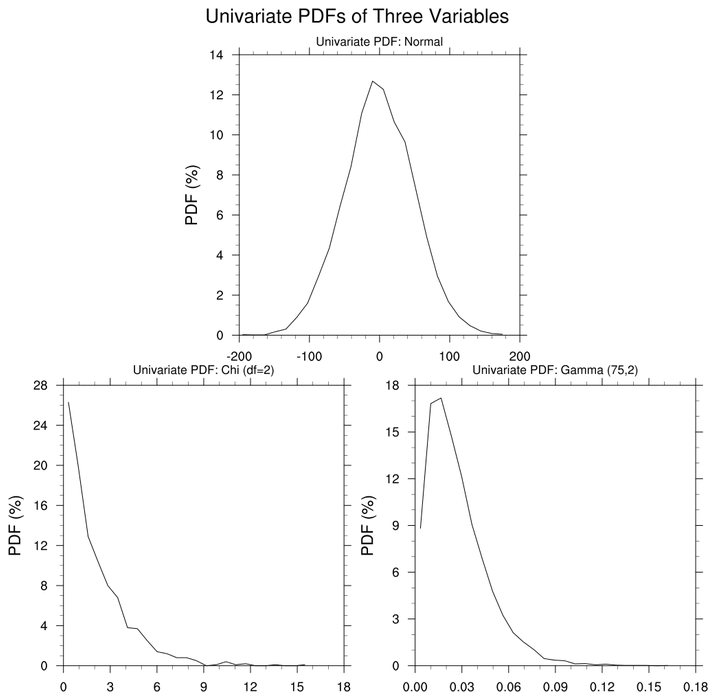
Original NCL script: https://www.ncl.ucar.edu/Applications/Scripts/pdf_1.ncl
Original NCL plot: https://www.ncl.ucar.edu/Applications/Images/pdf_1_lg.png
Import packages:
import matplotlib.pyplot as plt
import matplotlib.ticker as ticker
import numpy as np
from scipy import stats

import geocat.viz as gv
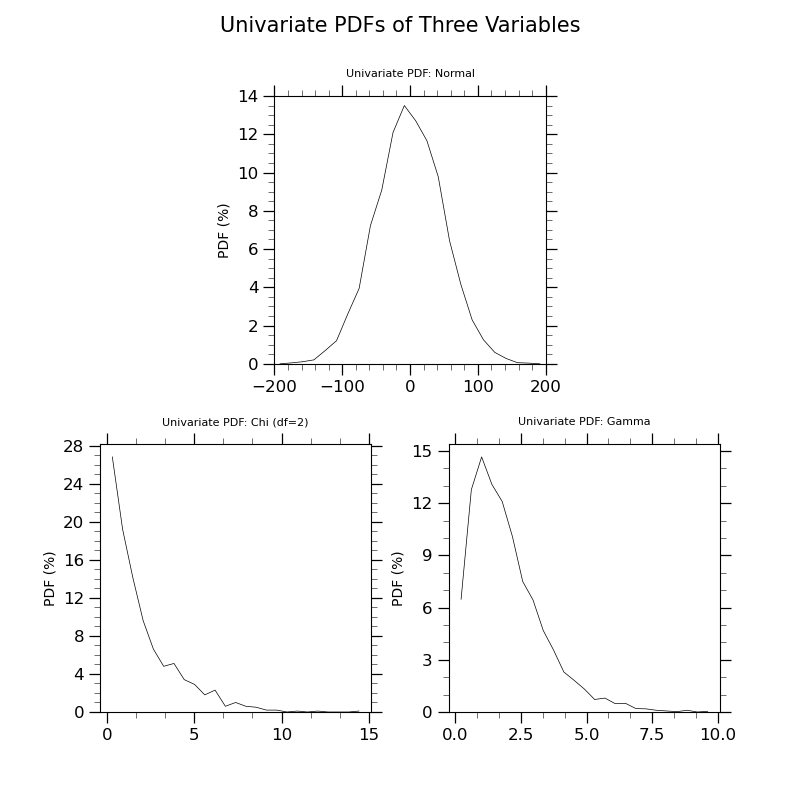
Generate univariate probability distributions:
# Normal distribution
mu = 0
sigma = 50
normalpdf = stats.norm.rvs(mu, sigma, size=(64, 128))
normalhist, normalbins = np.histogram(normalpdf, bins=np.linspace(-200, 200, 25))
normalhist = normalhist / (64 * 128) * 100
normalbincenters = 0.5 * (normalbins[1:] + normalbins[:-1])

# Chi-squared distribution
df = 2
chipdf = stats.chi2.rvs(df, size=1000)
chihist, chibins = np.histogram(chipdf, bins=25)
chihist = chihist / 1000 * 100
chibincenters = 0.5 * (chibins[1:] + chibins[:-1])

# Gamma distribution
a = 2
gammapdf = stats.gamma.rvs(a, size=(50, 100))
gammahist, gammabins = np.histogram(gammapdf, bins=25)
gammahist = gammahist / (50 * 100) * 100
gammabincenters = 0.5 * (gammabins[1:] + gammabins[:-1])
Plot:
# Set up figure using a subplot grid to create top centered plot
# Having a 4x2 subplot grid and having each plot span 2 columns allows for the top
# plot to span middle two columns
fig = plt.figure(figsize=(8, 8))
gs = plt.GridSpec(2, 4, figure=fig, hspace=0.3, wspace=0.8)

# Arrange plots, each spanning two columns
ax1 = plt.subplot(gs[0, 1:3])
ax2 = plt.subplot(gs[1, 0:2])
ax3 = plt.subplot(gs[1, 2:4])

# Plot normal distribution
ax1.plot(normalbincenters, normalhist, color='k', linewidth=0.5)

# Plot chi-squared distribution
ax2.plot(chibincenters, chihist, color='k', linewidth=0.5)

# Plot gamma distribution
ax3.plot(gammabincenters, gammahist, color='k', linewidth=0.5)

# Set top level title for plot
plt.suptitle("Univariate PDFs of Three Variables", fontsize=15)

# Use the geocat.viz function to set tile of centered top plot
gv.set_titles_and_labels(
    ax1,
    maintitle='Univariate PDF: Normal',
    maintitlefontsize=8,
    ylabel='PDF (%)',
    labelfontsize=10,
)

# Use the geocat.viz function to set tile of centered bottom left plot
gv.set_titles_and_labels(
    ax2,
    maintitle='Univariate PDF: Chi (df=2)',
    maintitlefontsize=8,
    ylabel='PDF (%)',
    labelfontsize=10,
)

# Use the geocat.viz function to set tile of centered bottom left plot
gv.set_titles_and_labels(
    ax3,
    maintitle='Univariate PDF: Gamma',
    maintitlefontsize=8,
    ylabel='PDF (%)',
    labelfontsize=10,
)

# Use geocat.viz.util convenience function to set axes parameters
# Set axes limits, and tick values on x-axes.
gv.set_axes_limits_and_ticks(
    ax1, xlim=(-200, 200), ylim=(0, 14), yticks=np.arange(0, 15, 2)
)

# Use matplotlib.ticker to ensure ticks count by 5 (base), but not specify an
# upper limit to allow for variability in x axis upper limit
ax2.xaxis.set_major_locator(ticker.MultipleLocator(base=5))

# Use matplotlib.ticker to ensure ticks count by 4 (base), but not specify an
# upper limit to allow for variability in y axis upper limit
ax2.yaxis.set_major_locator(ticker.MultipleLocator(base=4))

# Set lower limit only of y axis
ax2.set_ylim(bottom=0)

# Use matplotlib.ticker to ensure ticks count by 2.5 (base), but not specify an
# upper limit to allow for variability in x axis upper limit
ax3.xaxis.set_major_locator(ticker.MultipleLocator(base=2.5))

# Use matplotlib.ticker to ensure ticks count by 3 (base), but not specify an
# upper limit to allow for variability in y axis upper limit
ax3.yaxis.set_major_locator(ticker.MultipleLocator(base=3))

# Set lower limit only of y axis
ax3.set_ylim(bottom=0)

# Use geocat.viz.util convenience function to add minor and major tick lines
gv.add_major_minor_ticks(ax1, x_minor_per_major=5, y_minor_per_major=4, labelsize=12)

# Use geocat.viz.util convenience function to add minor and major tick lines
gv.add_major_minor_ticks(ax2, x_minor_per_major=3, y_minor_per_major=4, labelsize=12)

# Use geocat.viz.util convenience function to add minor and major tick lines
gv.add_major_minor_ticks(ax3, x_minor_per_major=3, y_minor_per_major=3, labelsize=12)

plt.show()
Total running time of the script: (0 minutes 0.190 seconds)