

Note
Go to the end to download the full example code.
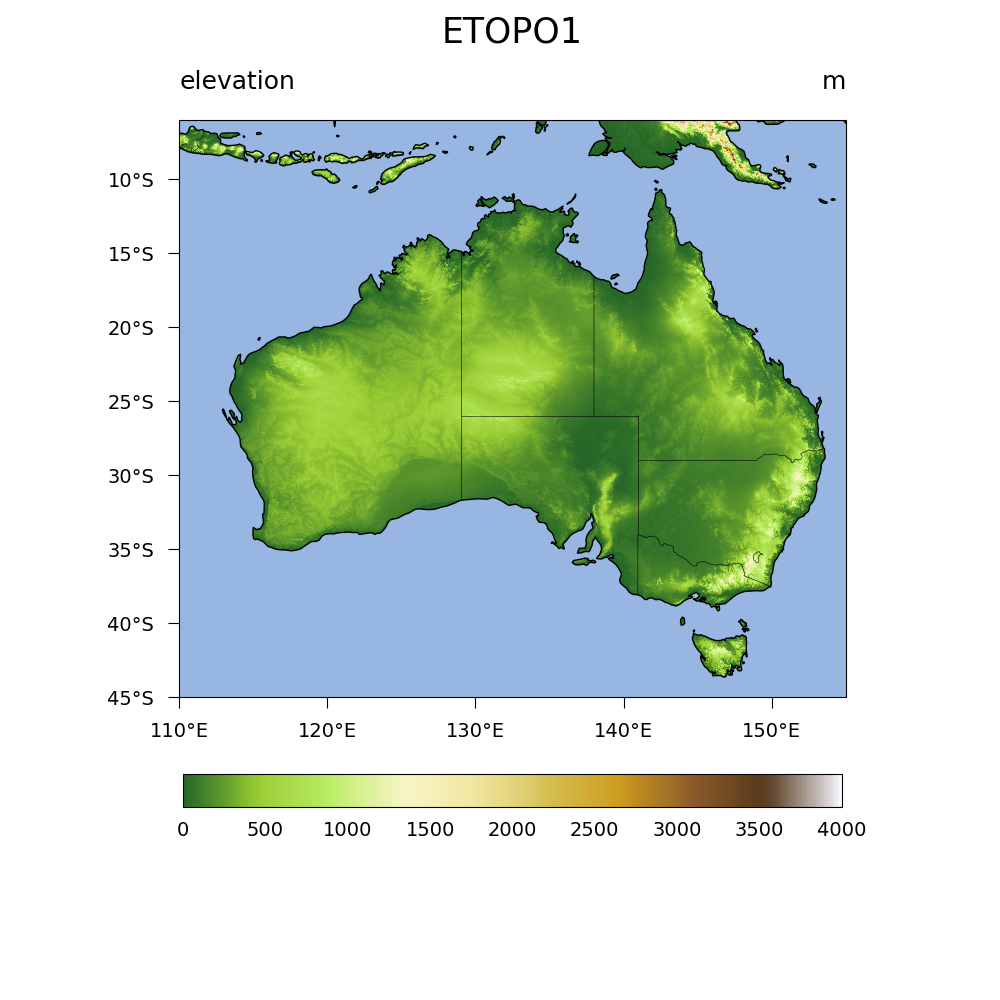
NCL_topo_4.py#
- This script illustrates the following concepts:
Drawing a topographic map using 1’ data
Drawing topographic data using an original NCL colormap
Plotting a specific region of the world
Masking ocean elevation data
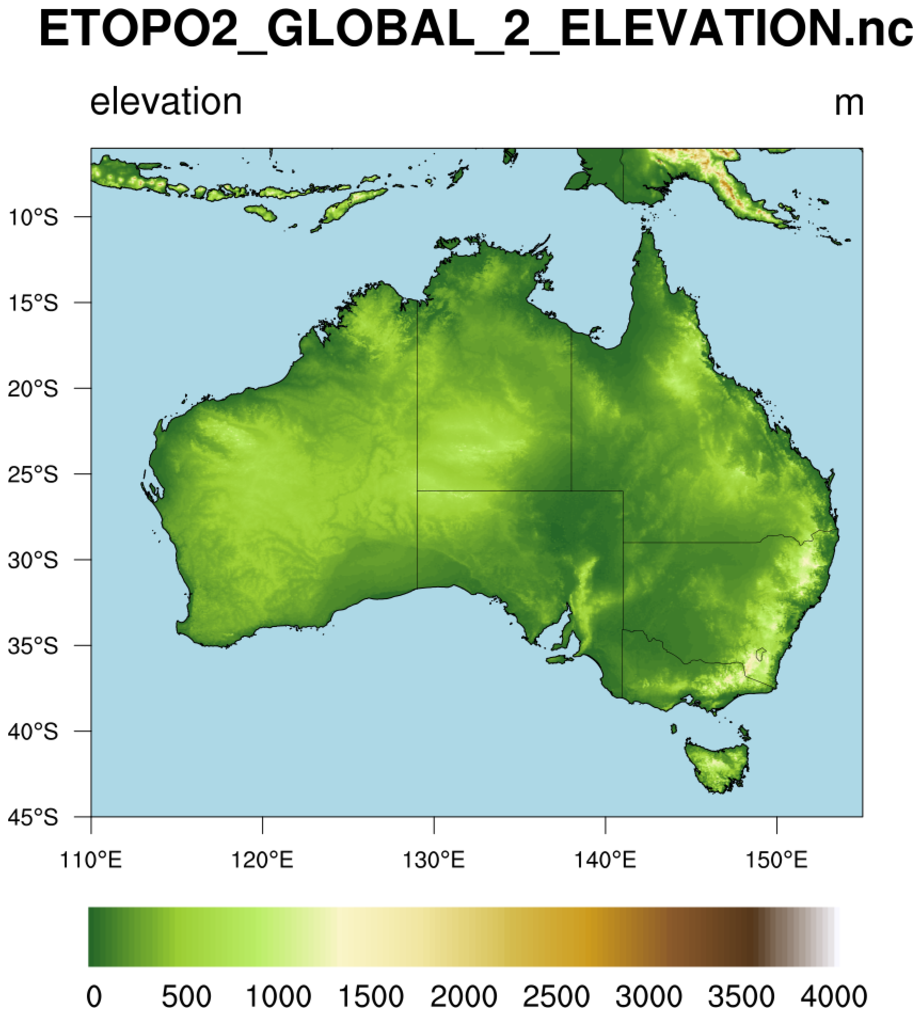
- See following URLs to see the reproduced NCL plot & script:
Original NCL script: https://www.ncl.ucar.edu/Applications/Scripts/topo_4.ncl
Original NCL plot: https://www.ncl.ucar.edu/Applications/Images/topo_4_lg.png
- Note:
In the original NCL script, the ETOPO2 dataset was used. For this example, we use the newer 1’ data, ETOPO1.
Import packages:
import matplotlib.pyplot as plt
import xarray as xr
import numpy as np
import cartopy.crs as ccrs
import cartopy.feature as cfeature
import cmaps

import geocat.viz as gv
import geocat.datafiles as gdf
Read in data:
# Note: The dataset used in this example is a subset of the ETOPO1 global elevation dataset which can be downloaded here: https://www.ngdc.noaa.gov/mgg/global/

# Open a netCDF file using xarray
ds = xr.open_dataset(gdf.get('netcdf_files/aus_elev.nc'))

# Select elevation data
ds = ds.z
Plot
# Generate figure and set size
plt.figure(figsize=(10, 10))

# Generate axes, using Cartopy
projection = ccrs.PlateCarree()
ax = plt.axes(projection=projection)

# Add coastlines
ax.coastlines(zorder=10)

# Add state/territory borders
states_provinces = cfeature.NaturalEarthFeature(
    category='cultural',
    name='admin_1_states_provinces_lines',
    scale='50m',
    facecolor='none',
)

ax.add_feature(states_provinces, zorder=5, linewidth=0.4)

# Select NCL colormap and truncate to remove blue from lower end
cmap = cmaps.OceanLakeLandSnow
newcmap = gv.truncate_colormap(cmap=cmap, minval=0.01, maxval=1)

# Plot the elevation data
elev = ds.plot.imshow(
    ax=ax, transform=projection, cmap=newcmap, vmin=0, vmax=4000, add_colorbar=False
)

# Set extent of the plot
ax.set_extent([110, 155, -45, -5])

# Add ocean mask
ax.add_feature(cfeature.OCEAN, zorder=2)

# Add colorbar
cbar = plt.colorbar(
    ax=ax,
    mappable=elev,
    orientation='horizontal',
    pad=0.1,
    shrink=0.85,
    ticks=np.arange(0, 4500, 500),
)

# Remove the tick marks from the colorbar and set tick label size
cbar.ax.tick_params(size=0, labelsize=14)

# Set colorbar tick label distance
cbar.ax.xaxis.set_tick_params(pad=10)

# Use geocat-viz utility function to add left and right titles
gv.set_titles_and_labels(
    ax,
    lefttitle='elevation',
    righttitle='m',
    maintitle='ETOPO1',
    maintitlefontsize=23,
    xlabel="",
    ylabel="",
)

# Use geocat-viz utility function to format x and y tick labels
gv.set_axes_limits_and_ticks(
    ax,
    xlim=[110, 155],
    ylim=[-45, -6],
    xticks=np.arange(110, 160, 10),
    yticks=np.arange(-45, 10, 5),
)

# Use geocat-viz utility function to add lat/lon formatting for tick labels
gv.add_lat_lon_ticklabels(ax)

# Format tick-marks
ax.tick_params(labelsize=14, length=8, pad=10)

# Show the plot
plt.show()
Total running time of the script: (0 minutes 2.058 seconds)