

Note
Go to the end to download the full example code.
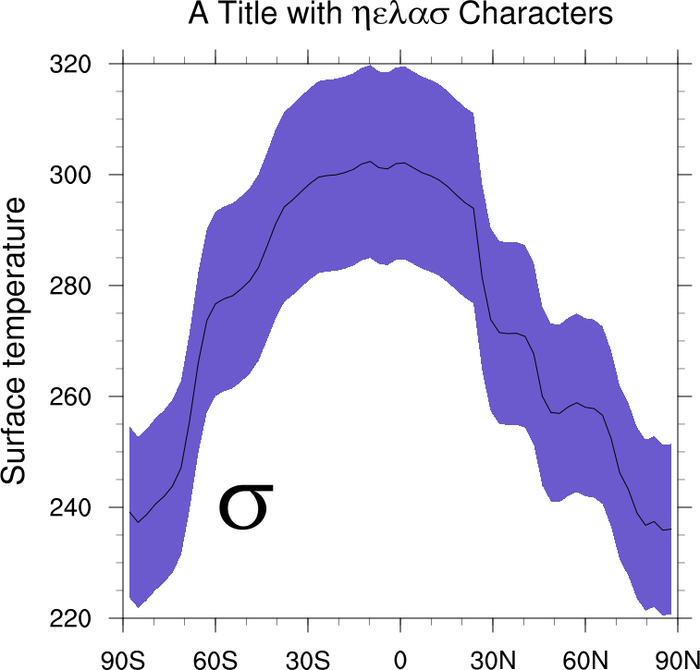
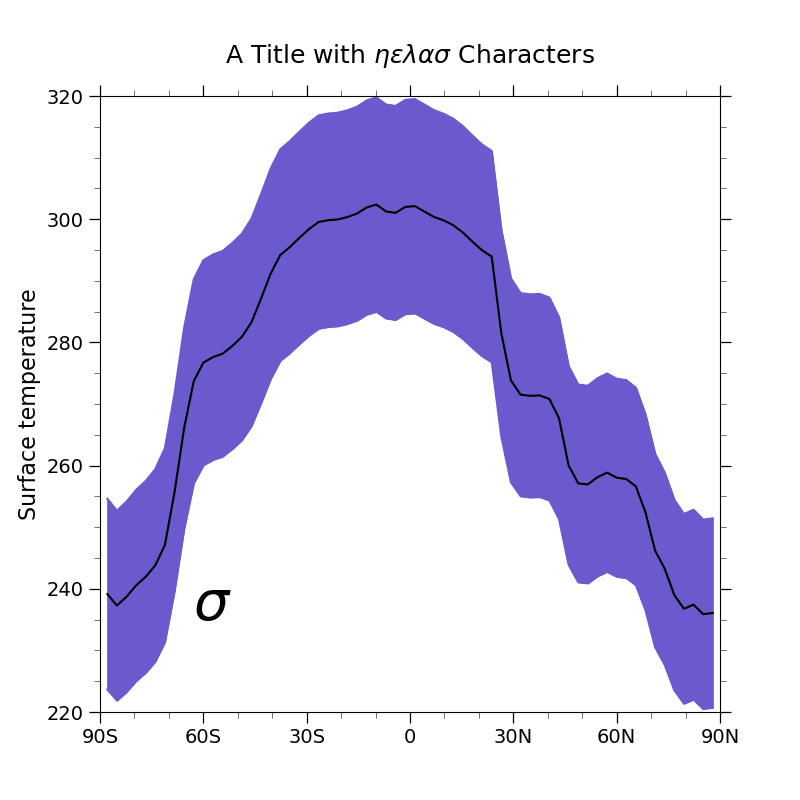
NCL_xy_10.py#
- This script illustrates the following concepts:
Filling the area between two curves in an XY plot
Drawing Greek characters on an XY plot
- See following URLs to see the reproduced NCL plot & script:
Original NCL script: https://www.ncl.ucar.edu/Applications/Scripts/xy_10.ncl
Original NCL plots: https://www.ncl.ucar.edu/Applications/Images/xy_10_lg.png
Import packages:
import numpy as np
import xarray as xr
import matplotlib.pyplot as plt
import math

import geocat.datafiles as gdf
import geocat.viz as gv
Read in data:
# Open a netCDF data file using xarray default engine and load the data into xarrays
ds = xr.open_dataset(gdf.get("netcdf_files/80.nc"))
# Extract slice of data
TS = ds.isel(time=0, lon=21, drop=True).TS
Define bounds for region centered on the data with a width of 2 sigma
nlat = np.shape(TS.lat)[0]
top = np.empty(nlat)
bottom = np.empty(nlat)

for k in range(0, nlat):
    dx = math.sqrt(TS[k])
    top[k] = TS[k] + dx
    bottom[k] = TS[k] - dx
Plot:
plt.figure(figsize=(8, 8))
ax = plt.axes()

# Plot data
TS.plot.line(ax=ax, color='black', _labels=False)

# Plot curves that bound the region to be colored
plt.plot(TS.lat, top, color='SlateBlue')
plt.plot(TS.lat, bottom, color='SlateBlue')

# Fill the area between the bounds
ax.fill_between(TS.lat, top, bottom, color='SlateBlue')

# Use geocat.viz.util convenience function to add minor and major tick lines
gv.add_major_minor_ticks(ax, x_minor_per_major=3, y_minor_per_major=4, labelsize=14)

# Use geocat.viz.util convenience function to set axes parameters
gv.set_axes_limits_and_ticks(
    ax,
    ylim=(220, 320),
    xlim=(-90, 90),
    xticks=np.arange(-90, 91, 30),
    xticklabels=['90S', '60S', '30S', '0', '30N', '60N', '90N'],
)

# Use geocat.viz.util convenience function to set titles and labels
gv.set_titles_and_labels(
    ax,
    maintitle=r"A Title with $\eta\epsilon\lambda\alpha\sigma$ Characters",
    ylabel=TS.long_name,
)

# Draw sigma on axes
ax.text(0.15, 0.15, r"$\sigma$", fontsize=40, transform=ax.transAxes)
plt.show()
Total running time of the script: (0 minutes 0.155 seconds)