

Note
Go to the end to download the full example code.
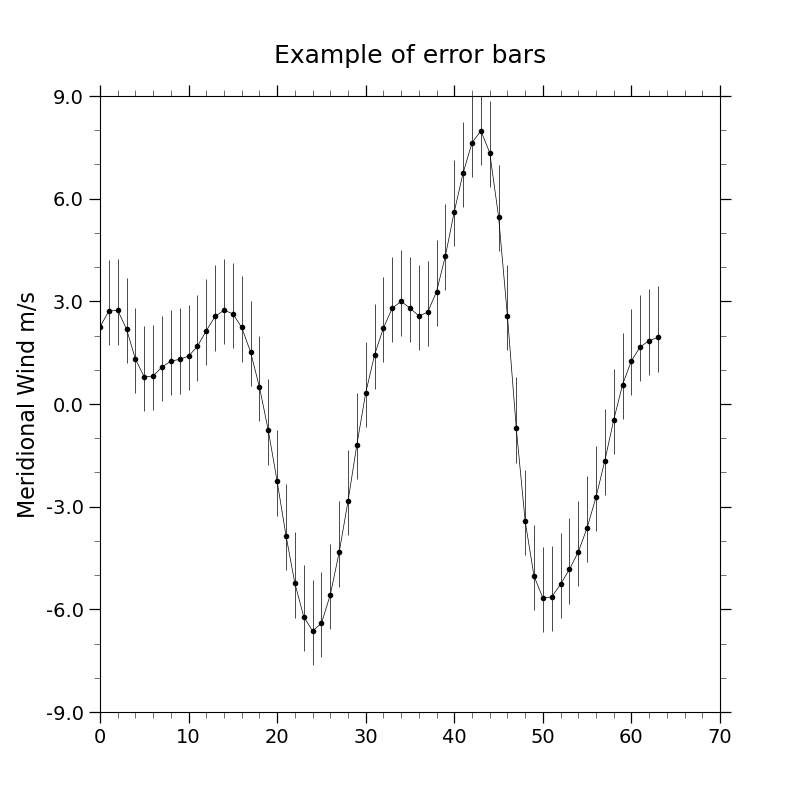
NCL_xy_13.py#
- This script illustrates the following concepts:
Adding error bars on an XY plot
- See following URLs to see the reproduced NCL plot & script:
Original NCL script: https://www.ncl.ucar.edu/Applications/Scripts/xy_13.ncl
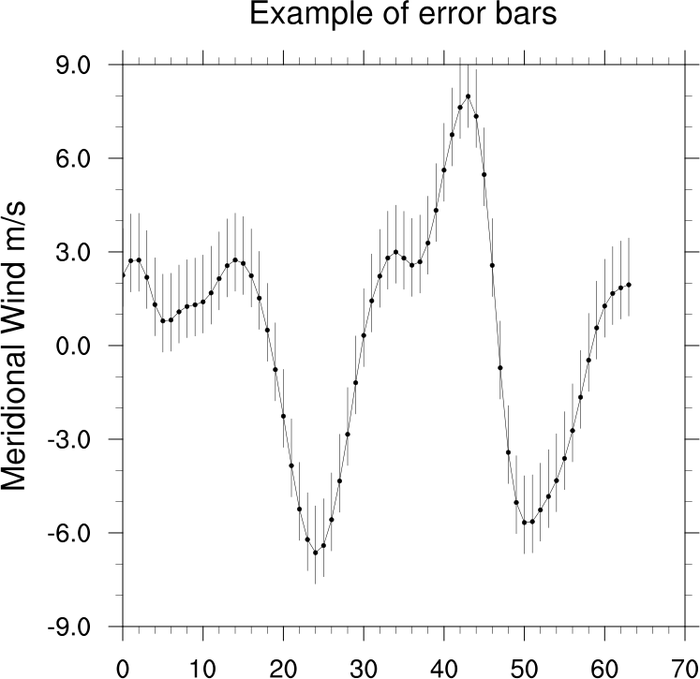
Original NCL plots: https://www.ncl.ucar.edu/Applications/Images/xy_13_lg.png
Import packages:
import numpy as np
import xarray as xr
import matplotlib.pyplot as plt
from matplotlib import collections as mc

import geocat.datafiles as gdf
import geocat.viz as gv
Read in data:
# Open a netCDF data file using xarray default engine and load the data into
# xarrays
ds = xr.open_dataset(gdf.get("netcdf_files/uv300.nc"))

# Extract data
V = ds.isel(time=0, lon=30, drop=True).V

# Create arrays to represent the magnitude of error above and below the line
# This data is arbitrary and you should replace these arrays with the actual
# error for your dataset
err_above = V.data + 1.5
err_below = V.data - 1
x = range(0, 64)  # the x values used to plot the data and error bars

# Make a tuple to represent the bottom and top points of the error bar
err_below = tuple(zip(x, err_below))
err_above = tuple(zip(x, err_above))

# Make a tuple containing those points to describe the line segment
segments = tuple(zip(err_below, err_above))

# Create a line collection so we can plot all of the segments with one call
bars = mc.LineCollection(segments, colors='black', linewidths=0.5)
Plot:
plt.figure(figsize=(8, 8))
ax = plt.axes()

# Plots the data with markers
plt.plot(x, V.data, color='black', linewidth=0.5, marker='.')

# Plot the error bars
ax.add_collection(bars)

# Use geocat.viz.util convenience function to set axes parameters
gv.set_axes_limits_and_ticks(
    ax,
    xlim=(0, 70),
    ylim=(-9, 9),
    xticks=np.arange(0, 71, 10),
    yticks=np.arange(-9, 10, 3),
    yticklabels=np.arange(-9.0, 10.0, 3.0),
)

# Use geocat.viz.util convenience function to add minor and major tick lines
gv.add_major_minor_ticks(ax, x_minor_per_major=5, y_minor_per_major=3, labelsize=14)

# Use geocat.viz.util convenience function to set titles and labels
gv.set_titles_and_labels(
    ax, maintitle="Example of error bars", ylabel=V.long_name + " " + V.units
)

plt.show()
Total running time of the script: (0 minutes 0.095 seconds)