

Note
Go to the end to download the full example code.
NCL_trans_1.py#
Calculate and plot a transect and transect location
- This script illustrates the following concepts:
How to calculate a transect with metpy’s
cross_sectionHow to plot the location of the transect
- See following URLs to see the related NCL plot & scripts:
Import packages:
import cartopy.crs as ccrs
import matplotlib.pyplot as plt
import xarray as xr
import numpy as np
from metpy.interpolate import cross_section
import cartopy.feature as cfeature

import geocat.datafiles as gdf
Read in data:
# Open a netCDF data file using xarray default engine and load the data into
# xarrays
ds = xr.open_dataset(gdf.get("netcdf_files/h_avg_Y0191_D000.00.nc"), decode_times=False)

# Add attrs and parse for CF compliance to work with metpy package
# only necessary if data is not CF compliant to start with
# See unidata.github.io/MetPy/latest/tutorials/xarray_tutorial.html#coordinates-and-coordinate-reference-systems
# and docs.xarray.dev/en/latest/user-guide/io.html#reading-encoded-data for more information
ds.time_bound.attrs['units'] = 'days since 0000-01-01 00:00:00'
ds.time_bound.attrs['calendar'] = 'noleap'
ds.time.attrs['calendar'] = 'noleap'
ds = xr.decode_cf(ds)

# format for metpy
ds = ds.metpy.assign_crs(
    grid_mapping_name='latitude_longitude', earth_radius=6371229.0
).rename({"lat_t": "lat", "lon_t": "lon"})


# Pull out temperature
t = ds.T[0, :, :, :]

# Define transect parameters
leftlat = -60
rightlat = -30

leftlon = -60
rightlon = 20

npts = 100
Calculate transect
# calculate with metpy's cross_section
transect = cross_section(t, (leftlat, leftlon), (rightlat, rightlon), steps=npts)
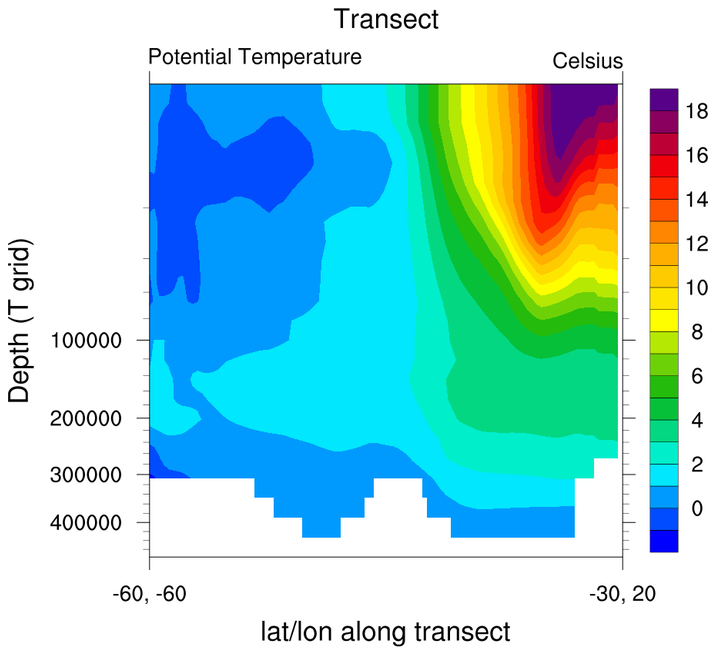
Plot transect
# format attributes for plotting
transect.attrs['long_name'] = transect.long_name + " Transect"

cmap = 'viridis'

fig, ax = plt.subplots(1, 1)
p = transect.plot.contourf(ax=ax, cmap=cmap, vmin=-2, vmax=19, levels=22)
ax.invert_yaxis()
plt.title(transect.long_name)

ax.set_xlabel('(lat, lon) along transect')
ax.set_xticks([transect.index.min(), transect.index.max()])
ax.set_xticklabels(['(-60, 60)', '(-30, 20)'])

# Show plot
plt.tight_layout()
plt.show()

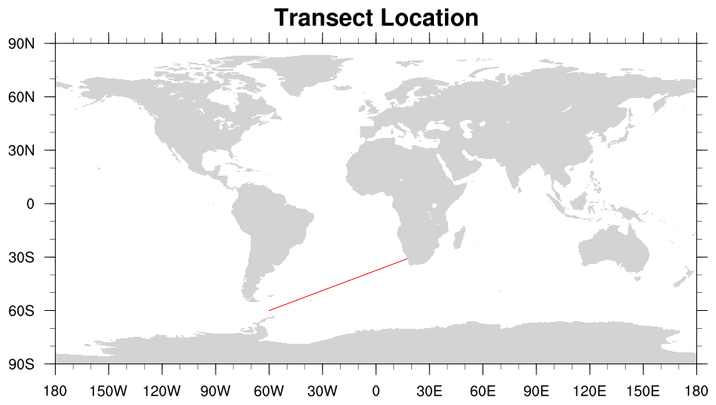
Plot transect location
projection = ccrs.PlateCarree()
fig = plt.figure()

ax = fig.add_subplot(1, 1, 1, projection=projection)
ax.set_global()

# Draw land
ax.add_feature(cfeature.LAND, color='lightgrey')

# Add transect location line
ax.plot(
    [leftlon, rightlon],
    [leftlat, rightlat],
    transform=projection,
    color='red',
    linewidth=1,
)

# title plot
ax.set_title("Transect Location")

# add ticks to axes
ax.set_xticks(np.linspace(-180, 180, 13))
ax.set_yticks(np.linspace(-90, 90, 7))

# Show plot
plt.tight_layout()
plt.show()

Total running time of the script: (0 minutes 0.441 seconds)