Note
Click here to download the full example code
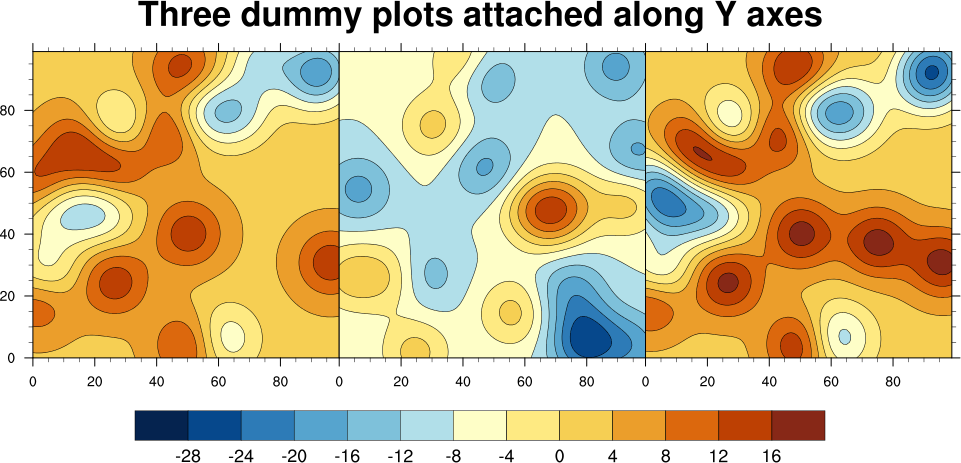
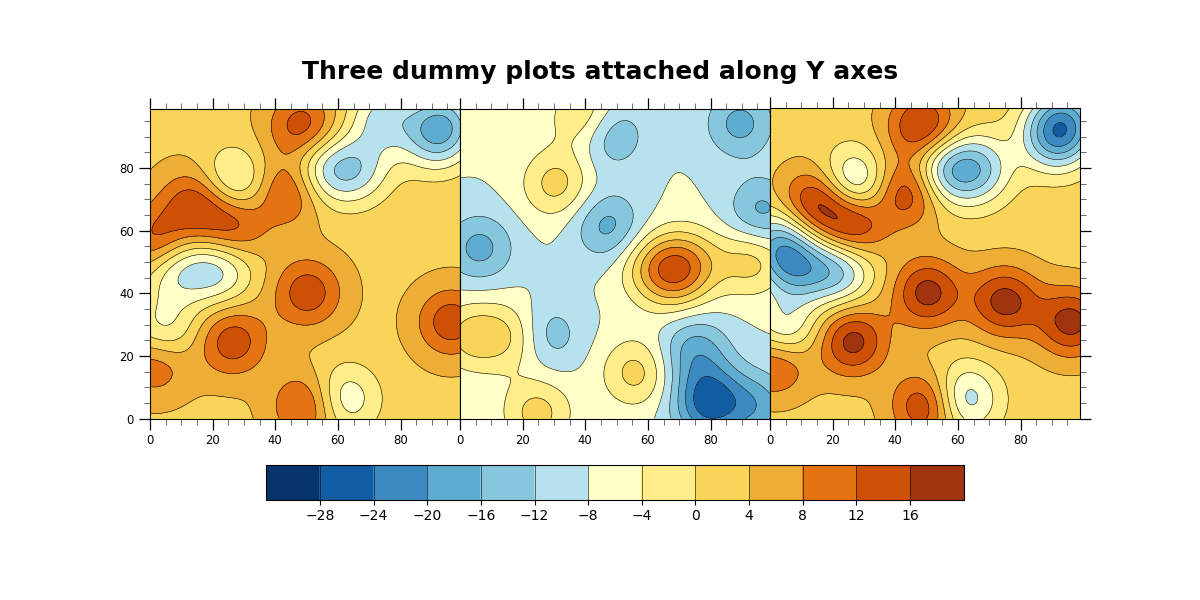
NCL_panel_35.py
- This script illustrates the following concepts:
Attaching three filled contour plots along Y axes
Adding a common colorbar to attached plots
Adding a common title to attached plots
Generating dummy data using “generate_2d_array”
Drawing a custom colorbar
Drawing a custom title
Retrieving the bounding box of a plot
- See following URLs to see the reproduced NCL plot & script:
Original NCL script: http://www.ncl.ucar.edu/Applications/Scripts/panel_35.ncl
Original NCL plot: http://www.ncl.ucar.edu/Applications/Images/panel_35_lg.png
Import packages:
import matplotlib.pyplot as plt
import numpy as np

from geocat.viz import cmaps as gvcmaps
import geocat.viz.util as gvutil

import math
Definition of generate_2d_array and helper functions from https://github.com/NCAR/pyngl/blob/develop/src/ngl/__init__.py
#  Globals for random number generator for generat_2d_array

dfran_iseq = 0
dfran_rseq = [.749, .973, .666, .804, .081, .483, .919, .903,   \
              .951, .960, .039, .269, .270, .756, .222, .478,   \
              .621, .063, .550, .798, .027, .569, .149, .697,   \
              .451, .738, .508, .041, .266, .249, .019, .191,   \
              .266, .625, .492, .940, .508, .406, .972, .311,   \
              .757, .378, .299, .536, .619, .844, .342, .295,   \
              .447, .499, .688, .193, .225, .520, .954, .749,   \
              .997, .693, .217, .273, .961, .948, .902, .104,   \
              .495, .257, .524, .100, .492, .347, .981, .019,   \
              .225, .806, .678, .710, .235, .600, .994, .758,   \
              .682, .373, .009, .469, .203, .730, .588, .603,   \
              .213, .495, .884, .032, .185, .127, .010, .180,   \
              .689, .354, .372, .429                            \
             ]

#  Random number generator for generate_2d_array.


def _dfran():
    global dfran_iseq
    global dfran_rseq
    dfran_iseq = dfran_iseq % 100
    r = dfran_rseq[dfran_iseq]
    dfran_iseq = dfran_iseq + 1
    return r

def generate_2d_array(dims, num_low, num_high, minv, maxv, seed=0, \
                      highs_at=None, lows_at=None):
    """Generates smooth 2D arrays primarily for use in examples.

    array = generate_2d_array(dims, num_low, num_high, minv, maxv, seed=0,
                              highs_at=None, lows_at=None)
    dims -- a list (or array) containing the dimensions of the
            two-dimensional array to be returned.
    num_low, num_high -- Integers representing the approximate minimum
                         and maximum number of highs and lows that the
                         output array will have. They must be in the
                         range 1 to 25. If not, then they will be set to
                         either 1 or 25.
    minv, maxv -- The exact minimum and maximum values that the output array
                  will have.
    iseed -- an optional argument specifying a seed for the random number
             generator.  If iseed is outside the range 0 to 99, it will
             be set to 0.
    lows_at -- an optional argument that is a list of coordinate
               pairs specifying where the lows will occur.  If this
               argument appears, then its length must equal num_low and
               the coordinates must be in the ranges specified in dims.
    highs_at -- an optional argument that is a list of coordinate
                pairs specifying where the highs will occur.  If this
                argument appears, then its length must equal num_high and
                the coordinates must be in the ranges specified in dims.
    """

    #  Globals for random numbers.

    global dfran_iseq
    dfran_iseq = seed

    #  Check arguments.

    try:
        alen = len(dims)
    except:
        print(
            "generate_2d_array: first argument must be a list, tuple, or array having two elements specifying the dimensions of the output array."
        )
        return None
    if (alen != 2):
        print(
            "generate_2d_array: first argument must have two elements specifying the dimensions of the output array."
        )
        return None
    if (int(dims[0]) <= 1 and int(dims[1]) <= 1):
        print("generate_2d_array: array must have at least two elements.")
        return None
    if (num_low < 1):
        print(
            "generate_2d_array: number of lows must be at least 1 - defaulting to 1."
        )
        num_low = 1
    if (num_low > 25):
        print(
            "generate_2d_array: number of lows must be at most 25 - defaulting to 25."
        )
        num_high = 25
    if (num_high < 1):
        print(
            "generate_2d_array: number of highs must be at least 1 - defaulting to 1."
        )
        num_high = 1
    if (num_high > 25):
        print(
            "generate_2d_array: number of highs must be at most 25 - defaulting to 25."
        )
        num_high = 25
    if (seed > 100 or seed < 0):
        print(
            "generate_2d_array: seed must be in the interval [0,100] - seed set to 0."
        )
        seed = 0
    if not lows_at is None:
        if (len(lows_at) != num_low):
            print(
                "generate_2d_array: the list of positions for the lows must be the same size as num_low."
            )
    if not highs_at is None:
        if (len(highs_at) != num_high):
            print(
                "generate_2d_array: the list of positions for the highs must be the same size as num_high."
            )


#  Dims are reversed in order to get the same results as the NCL function.

    nx = int(dims[1])
    ny = int(dims[0])
    out_array = np.zeros([nx, ny], 'f')
    tmp_array = np.zeros([3, 51], 'f')
    fovm = 9. / float(nx)
    fovn = 9. / float(ny)
    nlow = max(1, min(25, num_low))
    nhgh = max(1, min(25, num_high))
    ncnt = nlow + nhgh

    for k in range(num_low):
        if not lows_at is None:
            tmp_array[0,
                      k] = float(lows_at[k][1])  # lows at specified locations.
            tmp_array[1, k] = float(lows_at[k][0])
            tmp_array[2, k] = -1.
        else:
            tmp_array[0, k] = 1. + (float(nx) -
                                    1.) * _dfran()  # lows at random locations.
            tmp_array[1, k] = 1. + (float(ny) -
                                    1.) * _dfran()  # lows at random locations.
            tmp_array[2, k] = -1.
    for k in range(num_low, num_low + num_high):
        if not highs_at is None:
            tmp_array[0, k] = float(highs_at[k - num_low][1])  # highs locations
            tmp_array[1, k] = float(highs_at[k - num_low][0])  # highs locations
            tmp_array[2, k] = 1.
        else:
            tmp_array[0, k] = 1. + (float(nx) -
                                    1.) * _dfran()  # highs at random locations.
            tmp_array[1, k] = 1. + (float(ny) -
                                    1.) * _dfran()  # highs at random locations.
            tmp_array[2, k] = 1.

    dmin = 1.e+36
    dmax = -1.e+36
    midpt = 0.5 * (minv + maxv)
    for j in range(ny):
        for i in range(nx):
            out_array[i, j] = midpt
            for k in range(ncnt):
                tempi = fovm * (float(i + 1) - tmp_array[0, k])
                tempj = fovn * (float(j + 1) - tmp_array[1, k])
                temp = -(tempi * tempi + tempj * tempj)
                if (temp >= -20.):
                    out_array[i,j] = out_array[i,j] +    \
                       0.5*(maxv - minv)*tmp_array[2,k]*math.exp(temp)
            dmin = min(dmin, out_array[i, j])
            dmax = max(dmax, out_array[i, j])

    out_array = (((out_array - dmin) / (dmax - dmin)) * (maxv - minv)) + minv

    del tmp_array

    return np.transpose(out_array, [1, 0])


def _get_double(obj, name):
    return (NhlGetDouble(_int_id(obj), name))


def _get_double_array(obj, name):
    return (NhlGetDoubleArray(_int_id(obj), name))
Create dummy data
nx = 100
ny = 100
data1 = generate_2d_array((ny, nx), 10, 10, -19., 16., 0)
data2 = generate_2d_array((ny, nx), 10, 10, -28., 15., 1)
data3 = generate_2d_array((ny, nx), 10, 10, -25., 18., 2)
Create figure and axes using gvutil
fig, axs = plt.subplots(1,
                        3,
                        figsize=(12, 6),
                        sharex='all',
                        sharey='all',
                        gridspec_kw={'wspace': 0})

# Use geocat.viz.util convenience function to set axes tick values
gvutil.set_axes_limits_and_ticks(axs[0],
                                 xticks=np.arange(0, 100, 20),
                                 yticks=np.arange(0, 100, 20),
                                 xticklabels=np.arange(0, 100, 20),
                                 yticklabels=np.arange(0, 100, 20))
# Use geocat.viz.util convenience function to add minor and major tick lines
gvutil.add_major_minor_ticks(axs[0], x_minor_per_major=4, y_minor_per_major=4)
# Specify which edges of the subplot should have tick lines
axs[0].tick_params(axis='both', which='both', left=True, right=False)
# Force subplot to be square
axs[0].set_aspect(aspect='equal')

# Repeat for other subplots with a few changes
gvutil.set_axes_limits_and_ticks(axs[1],
                                 xticks=np.arange(0, 100, 20),
                                 yticks=np.arange(0, 100, 20),
                                 xticklabels=np.arange(0, 100, 20),
                                 yticklabels=np.arange(0, 100, 20))
gvutil.add_major_minor_ticks(axs[1], x_minor_per_major=4, y_minor_per_major=4)
axs[1].tick_params(axis='both', which='both', left=False, right=False)
axs[1].set_aspect(aspect='equal')

gvutil.set_axes_limits_and_ticks(axs[2],
                                 xticks=np.arange(0, 100, 20),
                                 yticks=np.arange(0, 100, 20),
                                 xticklabels=np.arange(0, 100, 20),
                                 yticklabels=np.arange(0, 100, 20))
gvutil.add_major_minor_ticks(axs[2], x_minor_per_major=4, y_minor_per_major=4)
axs[2].tick_params(axis='both', which='both', left=False, right=True)
axs[2].set_aspect(aspect='equal')

# Plot data and create colorbar
newcmap = gvcmaps.BlueYellowRed
# levels=contour_levels ensures that each plot has the same scale
contour_levels = np.arange(-32, 24, 4)

filled1 = axs[0].contourf(data1, cmap=newcmap, levels=contour_levels)
axs[0].contour(filled1, colors='black', linestyles='solid', linewidths=0.4)
filled2 = axs[1].contourf(data2, cmap=newcmap, levels=contour_levels)
axs[1].contour(filled2, colors='black', linestyles='solid', linewidths=0.4)
filled3 = axs[2].contourf(data3, cmap=newcmap, levels=contour_levels)
axs[2].contour(filled3, colors='black', linestyles='solid', linewidths=0.4)

plt.colorbar(filled3,
             orientation='horizontal',
             ax=axs,
             ticks=np.arange(-28, 20, 4),
             shrink=0.75,
             drawedges=True,
             pad=0.1)

# Add title
fig.suptitle("Three dummy plots attached along Y axes",
             horizontalalignment='center',
             y=0.9,
             fontsize=18,
             fontweight='bold',
             fontfamily='sans-serif')

plt.show()
Total running time of the script: ( 0 minutes 4.496 seconds)