Note
Click here to download the full example code
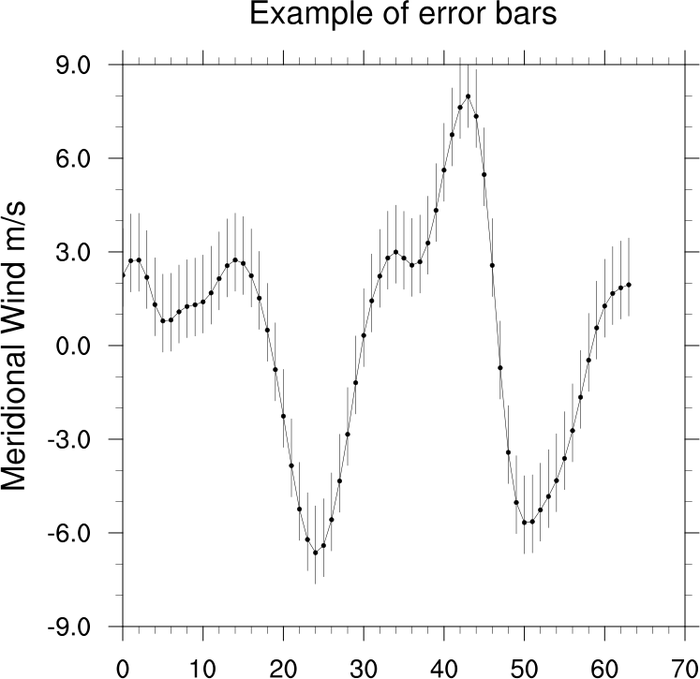
NCL_xy_13.py
- This script illustrates the following concepts:
Adding error bars on an XY plot
- See following URLs to see the reproduced NCL plot & script:
Original NCL script: https://www.ncl.ucar.edu/Applications/Scripts/xy_13.ncl
Original NCL plots: https://www.ncl.ucar.edu/Applications/Images/xy_13_lg.png
Import packages:
import numpy as np
import xarray as xr
import matplotlib.pyplot as plt
from matplotlib import collections as mc

import geocat.datafiles as gdf
from geocat.viz import util as gvutil
Read in data:
# Open a netCDF data file using xarray default engine and load the data into
# xarrays
ds = xr.open_dataset(gdf.get("netcdf_files/uv300.nc"))

# Extract data
V = ds.isel(time=0, lon=30, drop=True).V

# Create arrays to represent the magnitude of error above and below the line
# This data is arbitrary and you should replace these arrays with the actual
# error for your dataset
err_above = V.data + 1.5
err_below = V.data - 1
x = range(0, 64)  # the x values used to plot the data and error bars

# Make a tuple to represent the bottom and top points of the error bar
err_below = tuple(zip(x, err_below))
err_above = tuple(zip(x, err_above))

# Make a tuple containing those points to describe the line segment
segments = tuple(zip(err_below, err_above))

# Create a line collection so we can plot all of the segments with one call
bars = mc.LineCollection(segments, colors='black', linewidths=0.5)
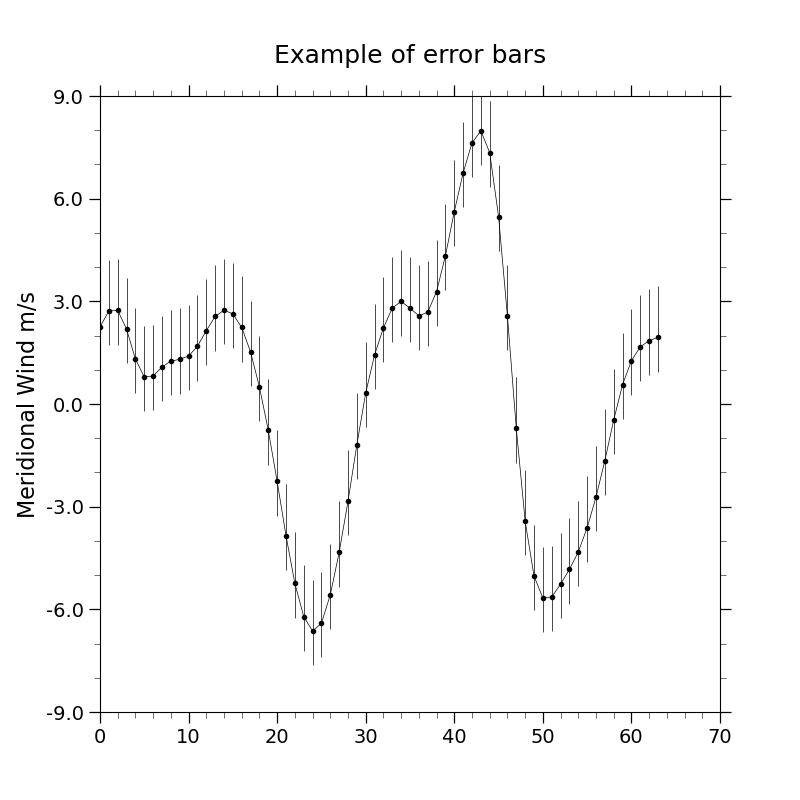
Plot:
plt.figure(figsize=(8, 8))
ax = plt.axes()

# Plots the data with markers
plt.plot(x, V.data, color='black', linewidth=0.5, marker='.')

# Plot the error bars
ax.add_collection(bars)

# Use geocat.viz.util convenience function to set axes parameters
gvutil.set_axes_limits_and_ticks(ax,
                                 xlim=(0, 70),
                                 ylim=(-9, 9),
                                 xticks=np.arange(0, 71, 10),
                                 yticks=np.arange(-9, 10, 3),
                                 yticklabels=np.arange(-9.0, 10.0, 3.0))

# Use geocat.viz.util convenience function to add minor and major tick lines
gvutil.add_major_minor_ticks(ax,
                             x_minor_per_major=5,
                             y_minor_per_major=3,
                             labelsize=14)

# Use geocat.viz.util convenience function to set titles and labels
gvutil.set_titles_and_labels(ax,
                             maintitle="Example of error bars",
                             ylabel=V.long_name + " " + V.units)

plt.show()
Total running time of the script: ( 0 minutes 0.215 seconds)